.jpg?width=289&height=168&name=Data%20Use%20cases%20(1).jpg)
When Bloomberg reported that the United States has spent $7.7 trillion since 2000 on disaster recovery and preparedness, an amount equal to 36 percent of all GDP growth over that period, it captured a structural shift in modern economics. Disasters aren’t rare interruptions anymore. They have become part of how modern economies spend to survive.
NOAA records show more than 400 disasters in the United States since 1980 that each caused over $1 billion in damage, together totaling nearly $3 trillion in direct losses.
Around the world, the scale isn’t much different. A 2022 UN Office for Disaster Risk Reduction (UNDRR) report states the average direct economic loss has more than doubled in the last three decades, and without immediate planning, they projected increase of 40% by 2030.
It’s a staggering cost, and it tells its own story — economies that keep rebuilding what they lost, faster each time, but not always wiser.
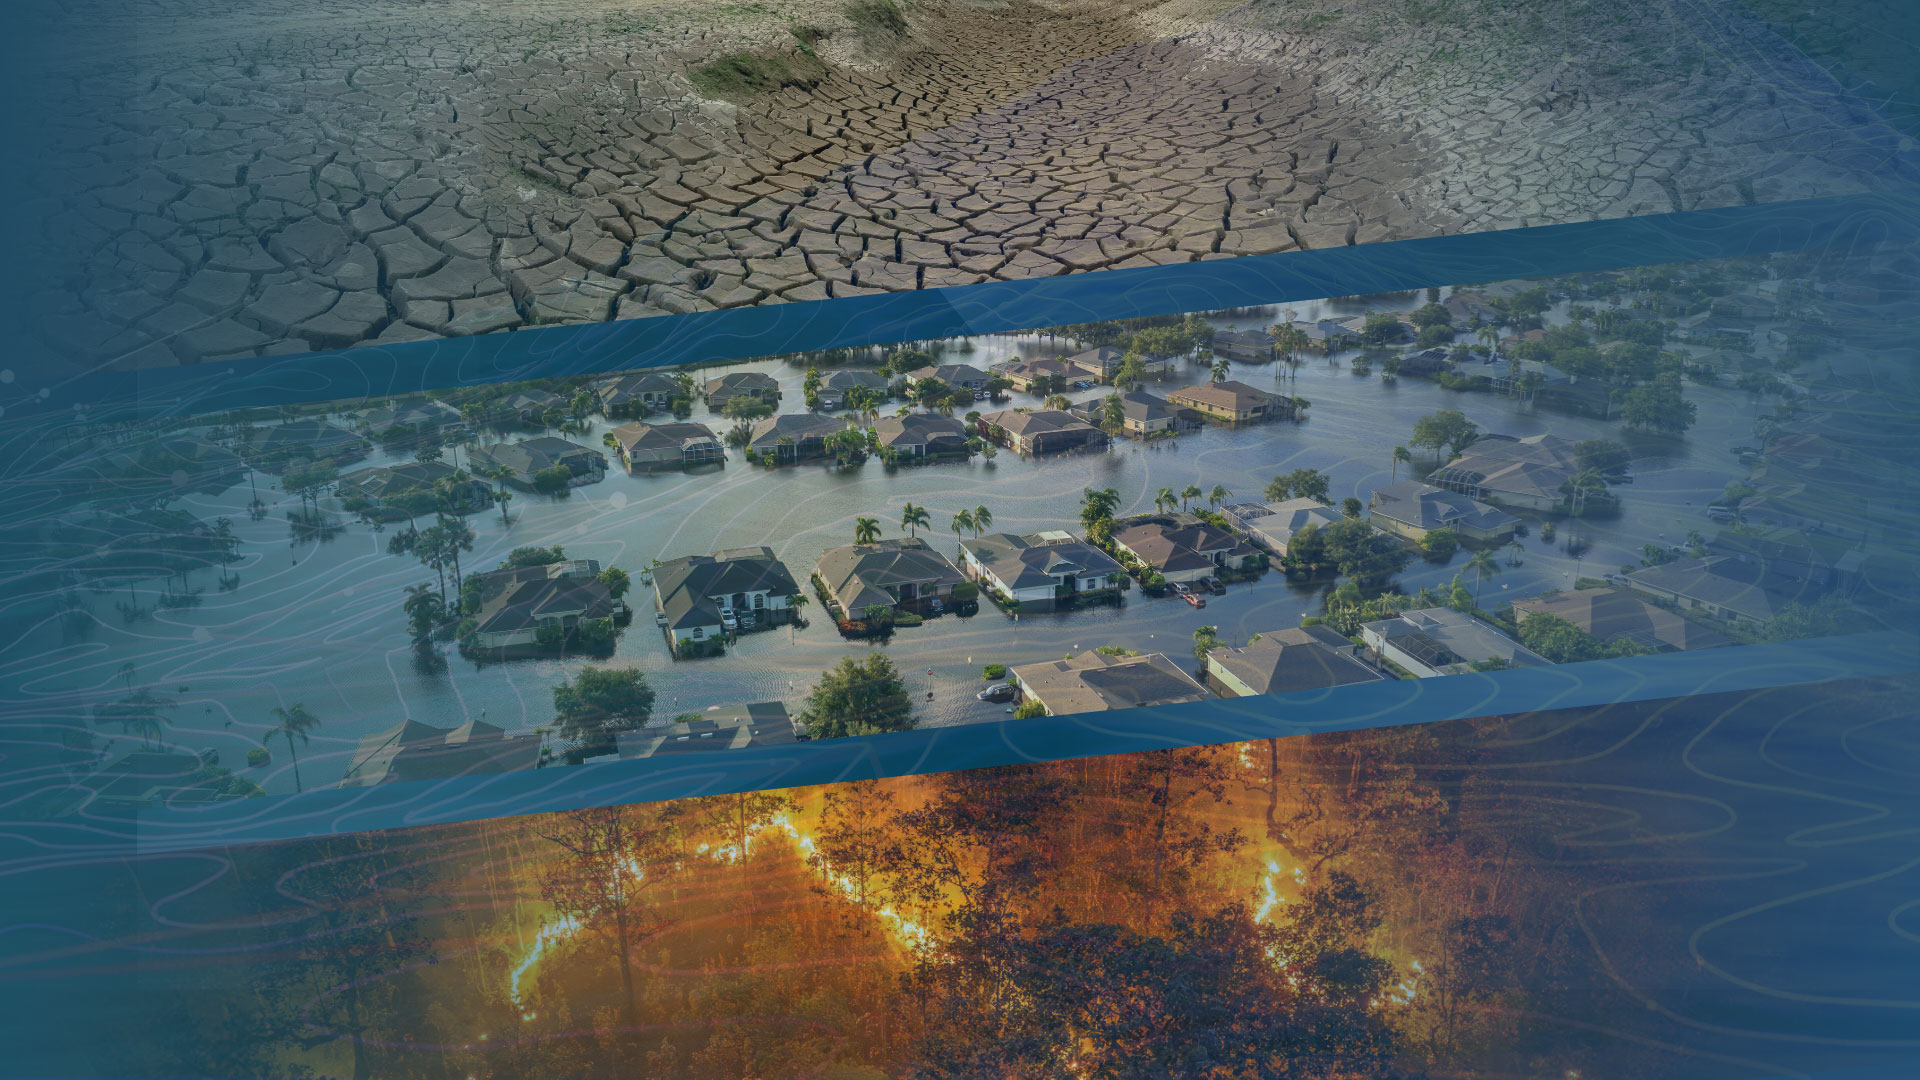
 The aftermath of Hurricane Ian in a Florida neighbourhood, 2017.
Why the Losses Keep Rising
Three forces converge to make disasters more expensive. Exposure has grown: more people and assets sit in harm’s way than ever before. Hazards themselves are shifting faster than the models built to predict them. Finally, the systems meant to manage those risks still run on data designed for a slower world.
Most systems still lean on old reference points: historic event catalogs, seasonal averages, scattered ground sensors. By the time a flood or wildfire is mapped in full, the damage has already worked its way through crops, balance sheets, and whole communities.
That’s the strange paradox of our time: information everywhere, yet not fast enough where it matters.
The Limits of Observation
Our ability to observe the Earth has expanded dramatically over the past decade. We have satellites capturing the Earth at meter-level every day, radar sensors penetrating clouds and smoke; thermal instruments tracing heat and moisture.
But raw imagery, however abundant, remains inert without context. And each sensor observes a fragment of reality — different wavelengths, resolutions, and update rates.
As a result, many organizations drown in pixels that arrive faster than they can be interpreted. Turning that flood of inputs into a single, reliable picture of risk still takes calibration, data fusion, and human judgment.
Where EarthDaily Fits In
EarthDaily marks a shift in how Earth observation data becomes usable intelligence. At its core is EarthOne, the enterprise platform that brings together everything from data to analytics in one continuous workflow. It manages the heavy lifting — pulling in, sorting, and processing massive volumes of geospatial information for responding in almost in real time. The platform scales with demand, automating what would otherwise take hours.
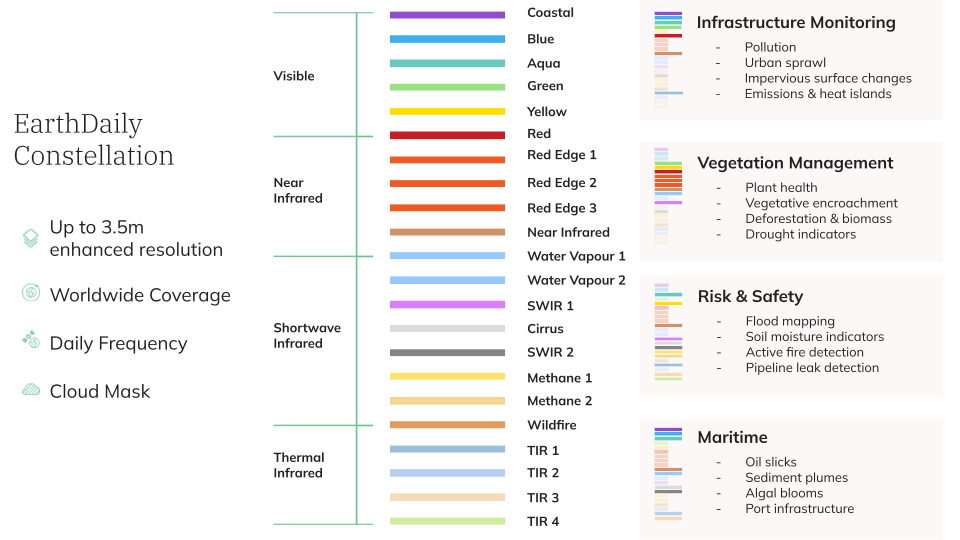
The upcoming EarthDaily Constellation will extend this capability even further. Designed to image the entire planet every day across 22 spectral bands, it will deliver science-grade data consistent enough for advanced analytics and machine learning. That daily global coverage will provide the foundation for more precise monitoring of environmental and industrial change.
Earth Intelligence in Action
Across sectors, EarthDaily delivers a single promise: decision-ready intelligence built on continuous, multi-source observation.
Property Risk: Seeing Clearly in the Aftermath
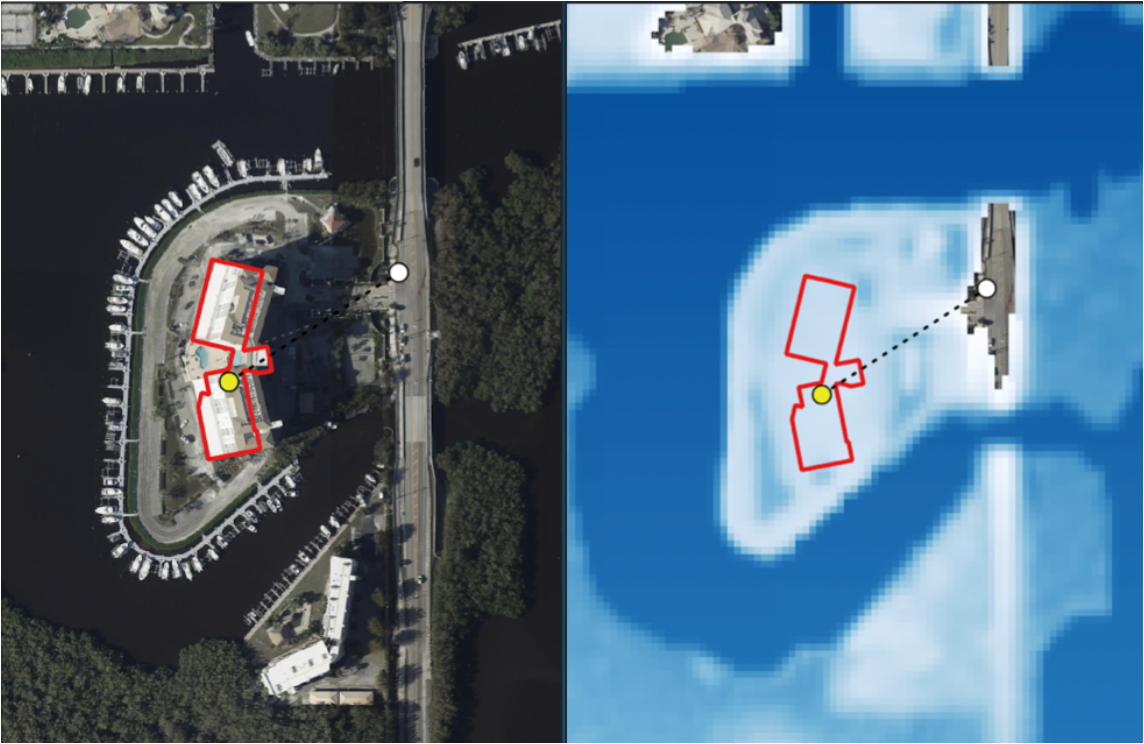
For insurers and reinsurers, the hours after a catastrophe define both financial exposure and customer confidence. EarthDaily’s Ascend platform merges optical and radar imagery with proprietary AI models to produce loss assessments within hours. During Hurricane Ian, precise geocoding and flood-depth mapping revealed differences of just over 100 metres that shifted entire claims outcomes.
 Flooding after Hurricane Ian, 2017, pictured in EarthDaily’s Ascend platform. Flood data supplied by ICEYE shows flood depths of greater than 2m.
Post-event data refines how risk is modelled and priced, showing insurers what held and what failed. When the EarthDaily Constellation comes online, its daily global coverage will give insurers and governments a steady, verifiable baseline to track exposure and plan resilience before the next crisis.
Market Intelligence: Anticipating the Ripple
Disasters don’t end when the water recedes; the impact carries through to commodity markets. When fields dry up or ports flood, the signals show up first in data — long before they appear in price charts or supply reports. EarthDaily’s market-intelligence follows those shifts in real time, tracing how weather, production, and logistics interact.
- Early Forecast Insight: High-frequency forecast data helps firms read weather impacts and adjust trading positions before the information becomes public.
- Commodities Data: Continuous monitoring of well pads, refineries, pipelines, and ports gives a live view of supply conditions and transport routes ahead of the market.
The same analytic framework supports its agriculture and sustainability efforts — tracking how vegetation responds to stress or changes in soil moisture.
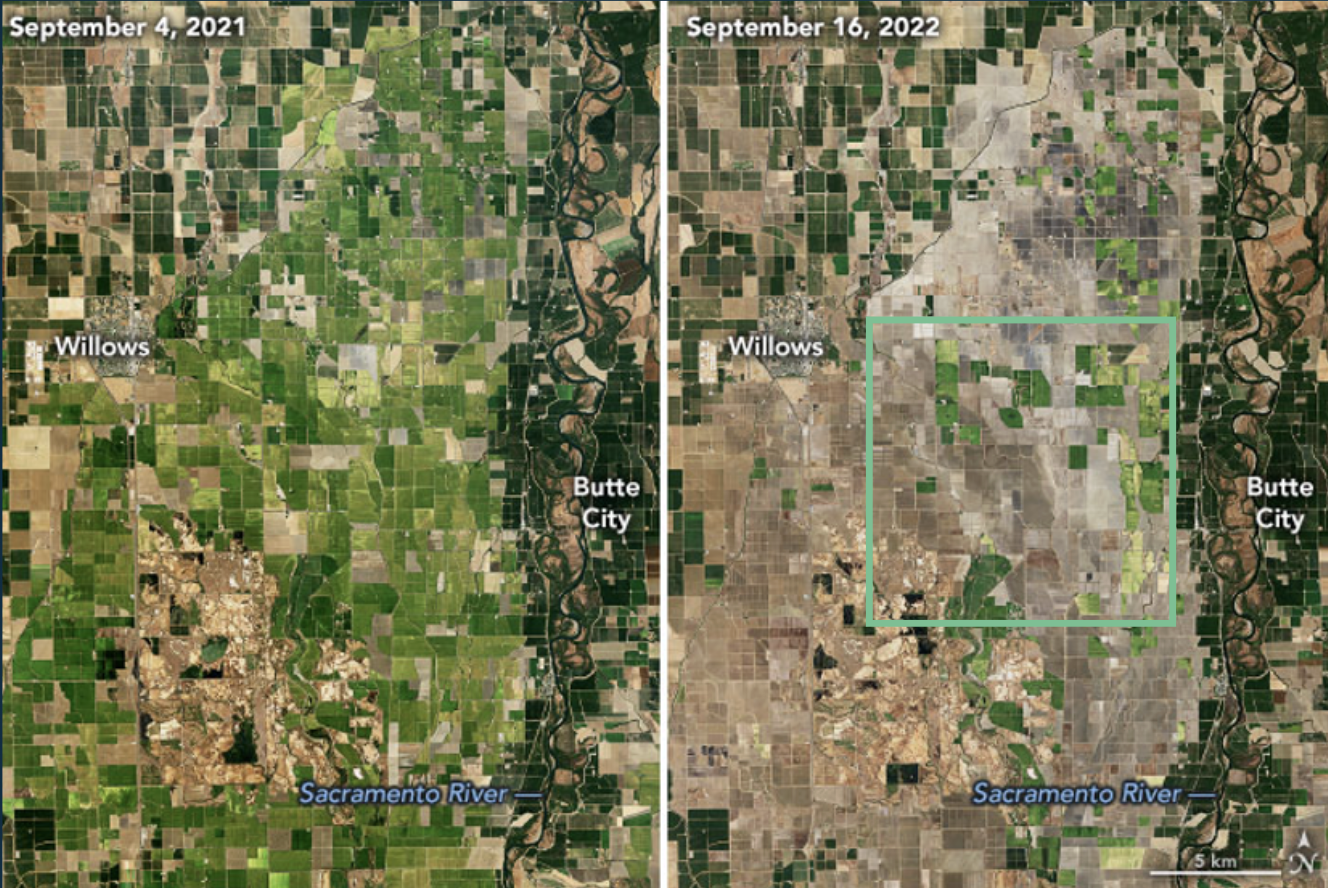
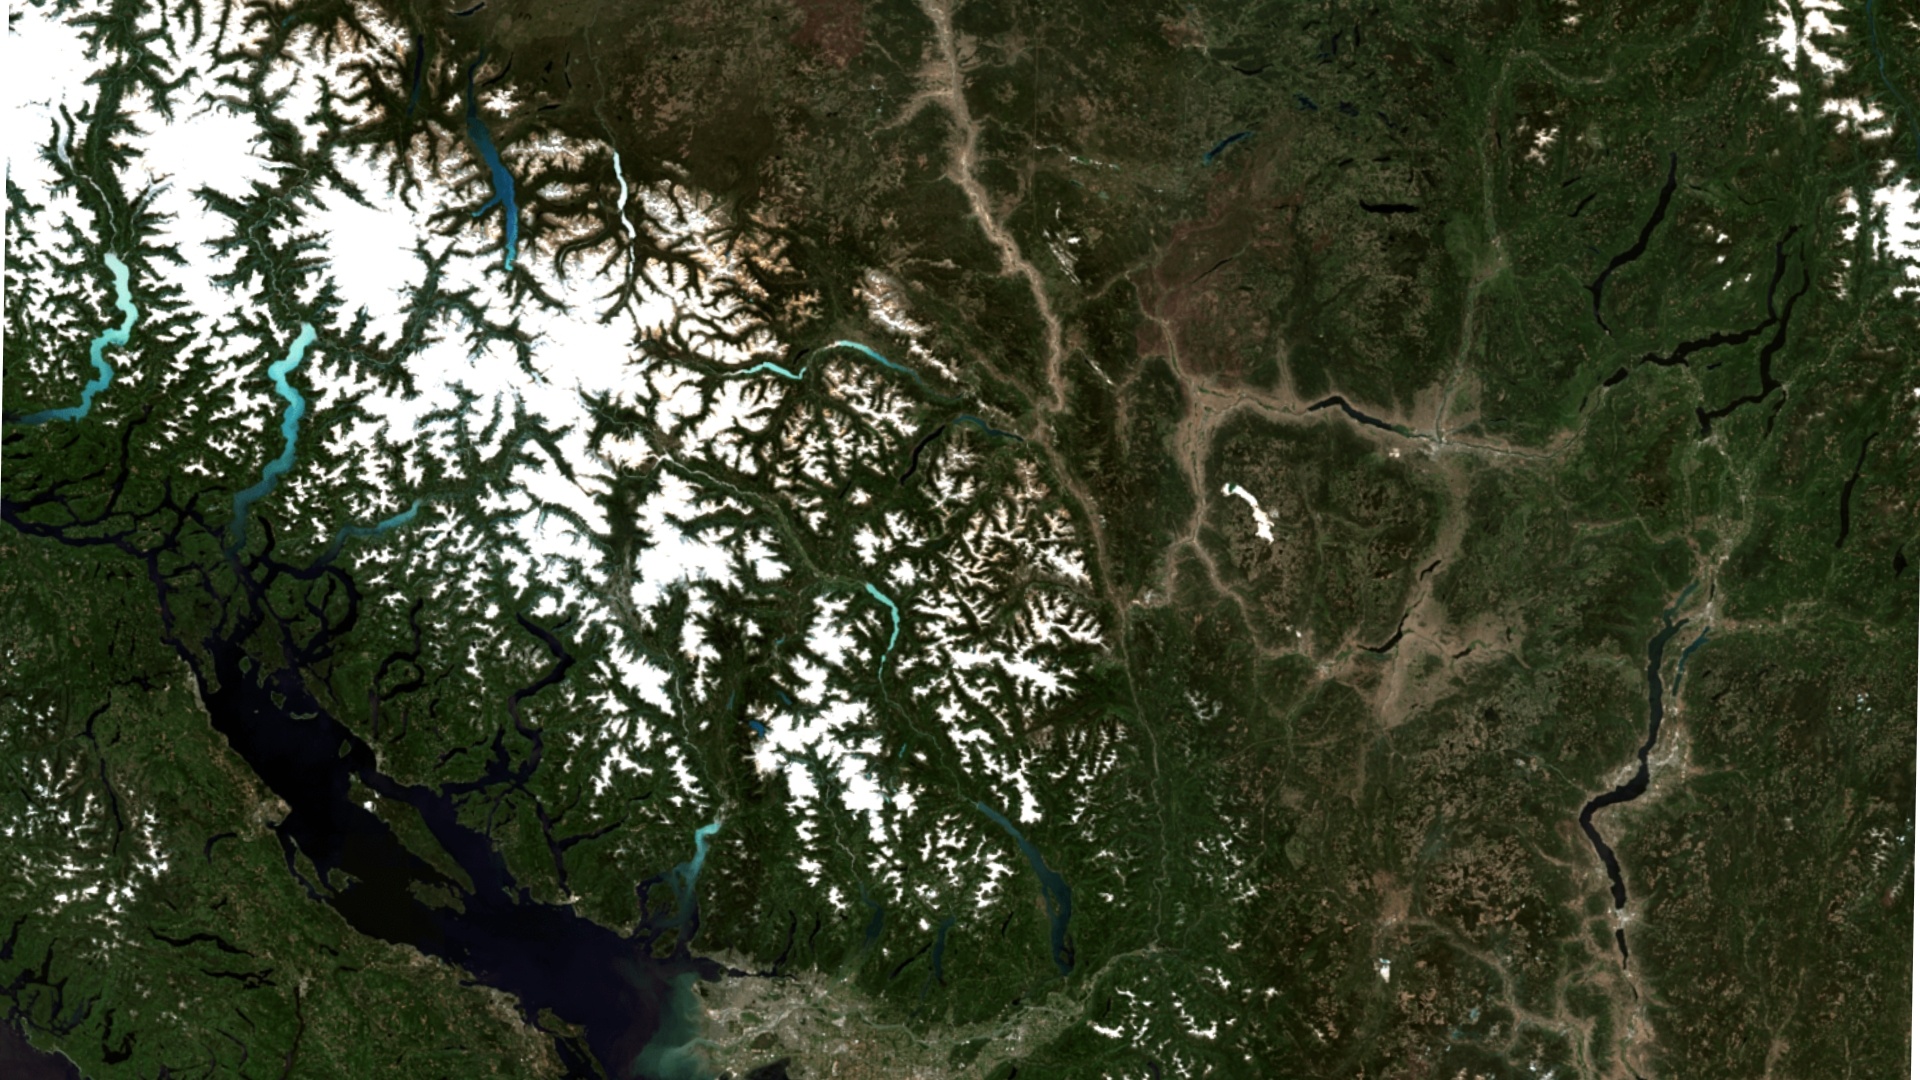
Drought near Butte City, Montana (2021-2022). (5m EarthDaily constellation simulated imagery. Data source: Landsat-8, courtesy of USGS)
Hazard Intelligence: Mapping Risk in Motion
Within EarthDaily’s government and environmental intelligence programs, hazard monitoring plays a central role. Hazards rarely appear as isolated events. They shift and expand across landscapes that are constantly changing. Floods carve new paths, wildfires reshape surface composition, and ground movement develops long before it becomes visible.
EarthDaily’s analytics draw on multi-sensor data to detect surface change, environmental stress, and early signs of exposure. For governments, insurers, and infrastructure operators, it delivers near-real-time insight into how risk evolves on the ground.
In wildfire regions, spectral and thermal readings capture the intensity of the burn and how quickly the ground begins to recover. Floodplains tell their own version of the story. Change detection and elevation models trace the way water moves across the land. Put together, those details build a record that keeps shifting with the ground itself, with the weather, and with whatever people keep adding on top of both.
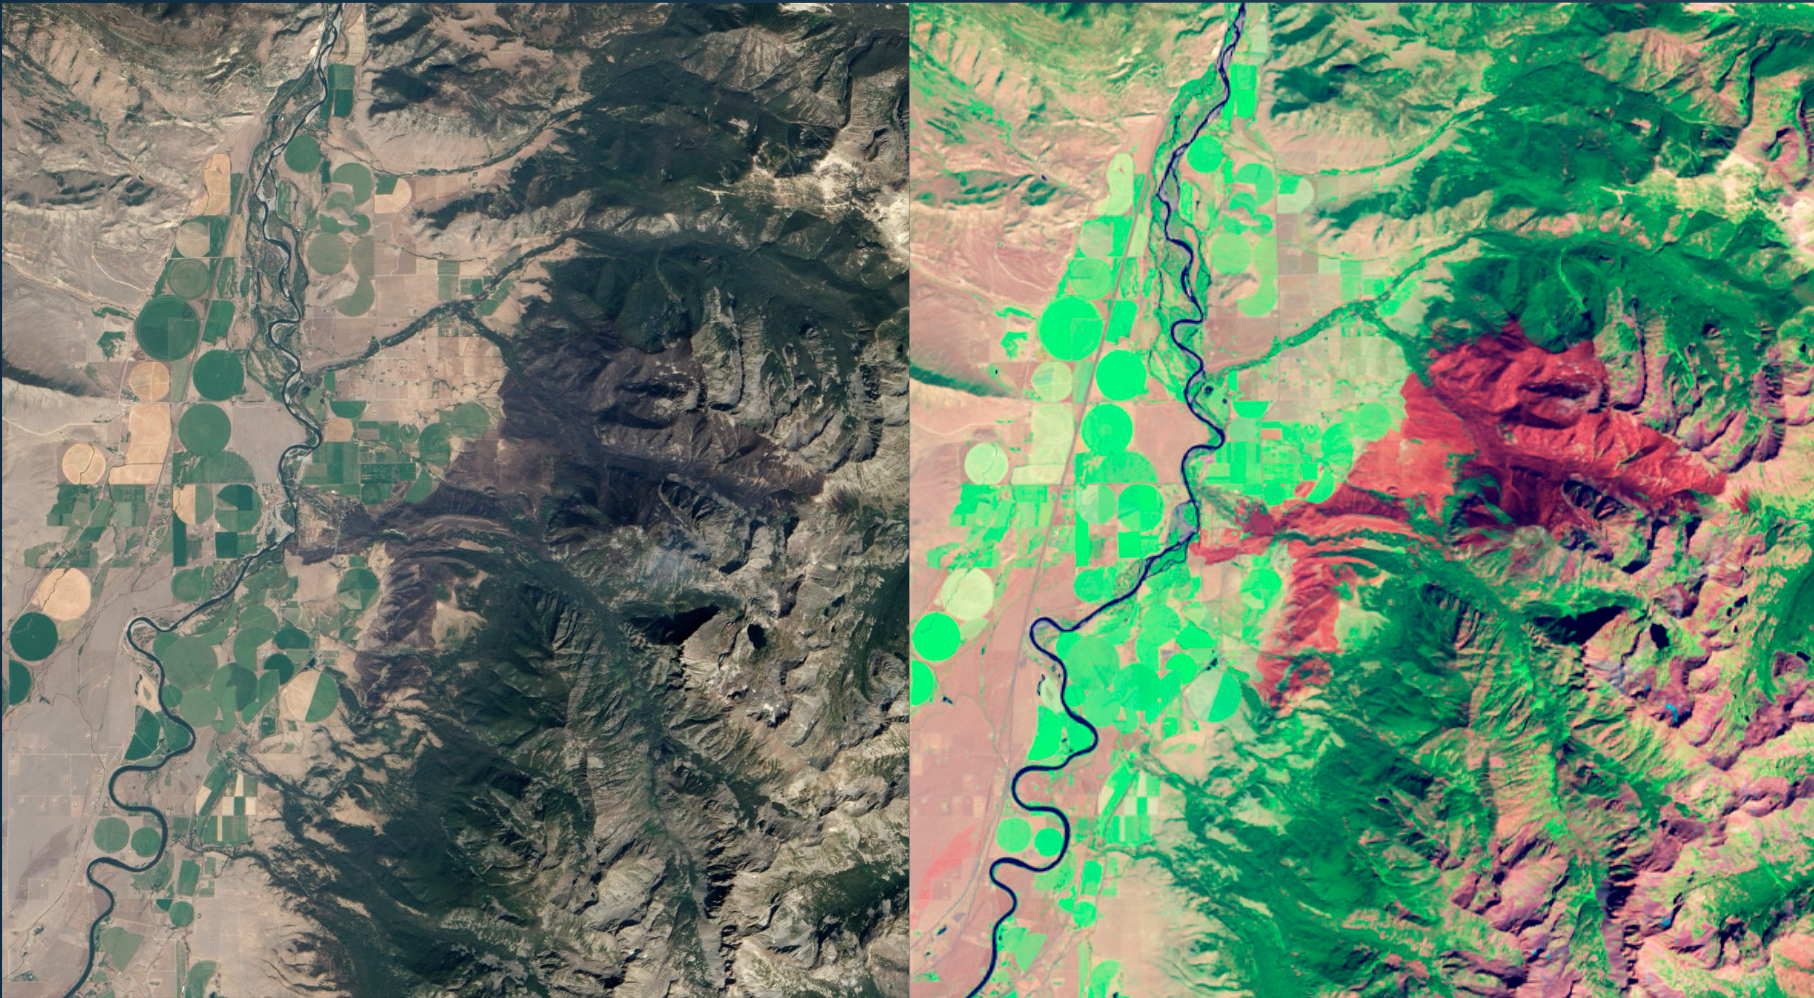
Wildfire burn scar from the Pine Creek Fire in Southern Montana in 2012. Left shows optical imagery of the aftermath of the fire, the right shows the burnt area in false colour. (5m EarthDaily constellation simulated imagery. Data source: Landsat-8, courtesy of USGS)
The Economics of Foresight
Every dollar spent on rebuilding usually means the right information arrived a little too late. According to the National Institute of Building Sciences, every $1 invested in mitigation saves an average of $13 in future disaster costs.
As continuous intelligence becomes part of everyday infrastructure, resilience turns measurable. Insurers adjust to live exposure, asset owners track conditions in real time, and governments weigh prevention against repair. The disaster economy won’t disappear, but it can evolve through an intelligence layer that links data, AI, and expertise to turn observation into foresight.
EarthDaily advances that shift, uniting reliable data streams and analytics fast enough for action -- before, during, and after a crisis.