
Science-Grade Earth
Observation Data
The measurement foundation for reliable Earth intelligence.
Most satellite imagery is built for visual interpretation, not measurement. Science-grade Earth observation data is calibrated, validated, and consistent over time, the properties that let measurements be trusted in decisions that carry real consequence.
-
What science-grade data actually is, and how it is built
-
Why measurement consistency is the foundation of reliable change detection
-
Why governments depend on data that stays comparable over time
-
34 pages, fully referenced, World Economic Forum, NASA, USGS, CEOS, Swiss Re
What the paper covers
The paper covers science-grade data from definition through to the workflows that depend on it. No remote-sensing background is assumed.
What science-grade data actually means
How the EarthDaily Constellation delivers it
Why it is the foundation of change detection
Why governments depend on consistency
What spatial quality really means
The road ahead: foundation models
Key figures from the paper
$700B
World Economic Forum & Deloitte
$263B
in annual EO value that remains unrealized.
World Economic Forum & Deloitte
80%
of analyst time spent preparing data rather than analyzing it.
Industry research
$117B
in annual value unrealized due to processing constraints.
World Economic Forum & Deloitte
Worked examples

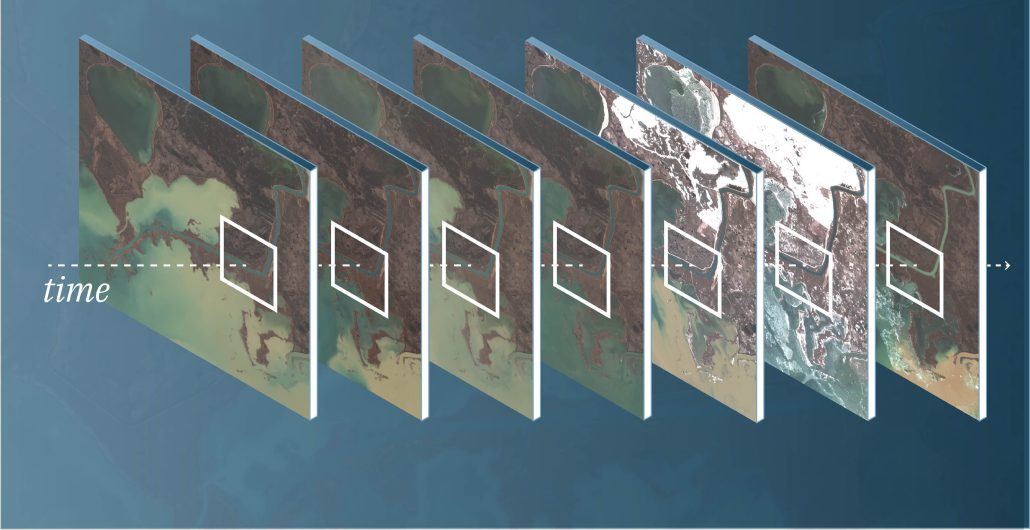
“Change detection is only as good as the consistency behind it. A record that holds its shape across time is what makes comparison reliable.”
Reliable change detection depends on measurements that line up cleanly from one pass to the next all calibrated, consistent, and spatially reliable.
Chapters 3 and 5 carry worked examples:
EDC 5 m imagery compared against Sentinel-2 and high-resolution reference imagery.
Fine electrical-grid structure preserved within a true 5 m product, and field boundaries that hold up for change detection over time.
Free download
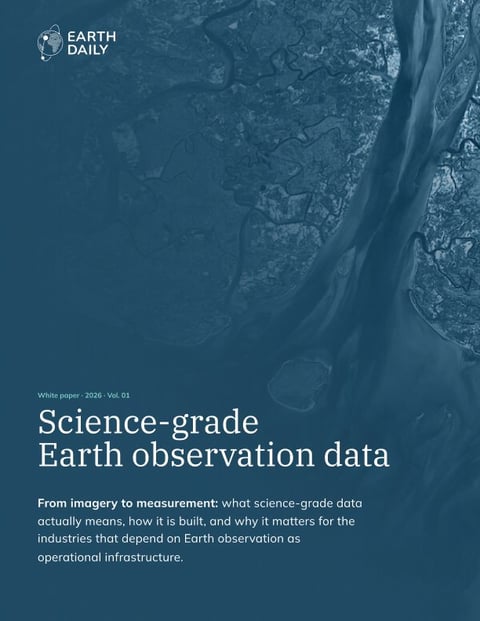
Download the white paper
34 pages, fully referenced and free to download. Covers what science-grade data is, how it is built, and why measurement consistency matters for the workflows that depend on it.