.jpg?width=289&height=168&name=Data%20Use%20cases%20(1).jpg)


Agronomists and advisors manage larger, more complex portfolios than ever before. Distinguishing a field trending positively from one quietly declining is subtle, yet critical, and often impossible without objective, standardized data. Digital Ag delivers a clear, up-to-date view of every field in your portfolio through harmonized indicators, trend monitoring, and anomaly detection, equipping advisors with the evidence they need to guide growers with confidence.
Purpose-built for agronomists, field advisors, and data science teams, Digital Ag provides the crop condition insights, historical benchmarks, and change detection analytics needed to monitor fields at scale, prioritize interventions, and power advanced modeling pipelines.
Instant Portfolio-Wide Visibility
Know exactly where to focus before problems become losses. Real-time crop condition insights, anomaly detection, and trend tracking across your entire operation, from a single field to hundreds of thousands of acres.
Objective Data for Trusted Advisory
Back your agronomic guidance with satellite-verified evidence. Justify input adjustments, flag underperforming fields, and intervene proactively when conditions shift. You retain full control of the "last mile," reinforcing your role as a trusted advisor.
A Foundational Data Layer for Advanced Analytics Standardized, AI-ready datasets feed directly into modeling pipelines. Curated agronomic indicators, crop conditions, and field-level metrics accelerate experimentation, improve model accuracy, and reduce iteration cycles for data science teams.
Vegetation indices, biophysical variables, weather data, phenology detection, and field benchmarking in a single platform.
10+ years of medium-resolution imagery (Sentinel-2, Landsat 8/9) plus low-resolution archives back to 2003 (MODIS) for long-term trend analysis and benchmarking.
All satellite sources are fully cross-calibrated to guarantee spatial and temporal consistency. Agriculture-specific cloud masking ensures clean, reliable inputs for downstream analytics.
Digital Ag combines multi-source satellite data with advanced analytics to deliver comprehensive field monitoring and agronomic insights.
Onboard your operation by creating Grower, Farm, and Field entities through multiple methods, including automated field creation, boundary selection layers (in select regions), or uploading existing boundaries. Update entities anytime as cropping cycles, land sales, or farm operations change. Analytics begin computing immediately.
Automated crop history identification saves time and enables accurate calculation of performance metrics with no data entry effort. Off-season crop cover duration estimates and tillage practices identification are also available on-demand.
A complete suite of indicators designed to surface issues quickly: track canopy development with NDVI, EVI, and GNDVI; assess yield proxies with LAI and Biomass; evaluate nitrogen nutrition with S2REP and NDRE; detect water stress with NDMI; and measure photosynthetic activity with FAPAR and FCover.
Continuous, season-long visibility into field performance. Medium-resolution time series (Sentinel-2, Landsat 8/9, premium tasked imagery) from 2019 onward with advanced denoising and smoothing to reveal the true biological signal. Low-resolution time series (MODIS) back to 2003 for deeper historical patterns, with planned Sentinel-3 integration for monitoring continuity.
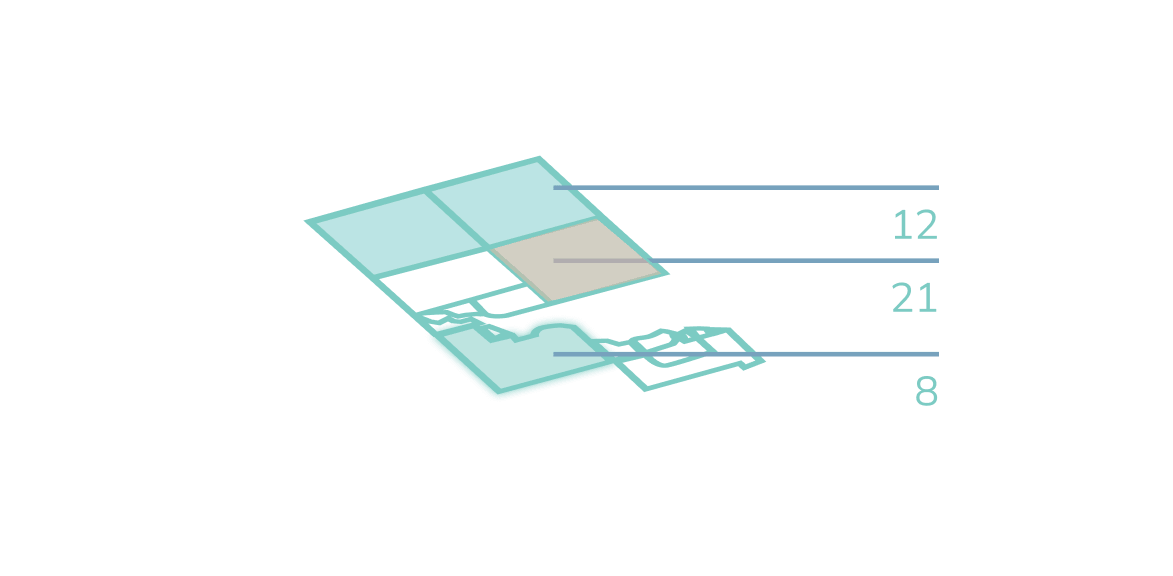
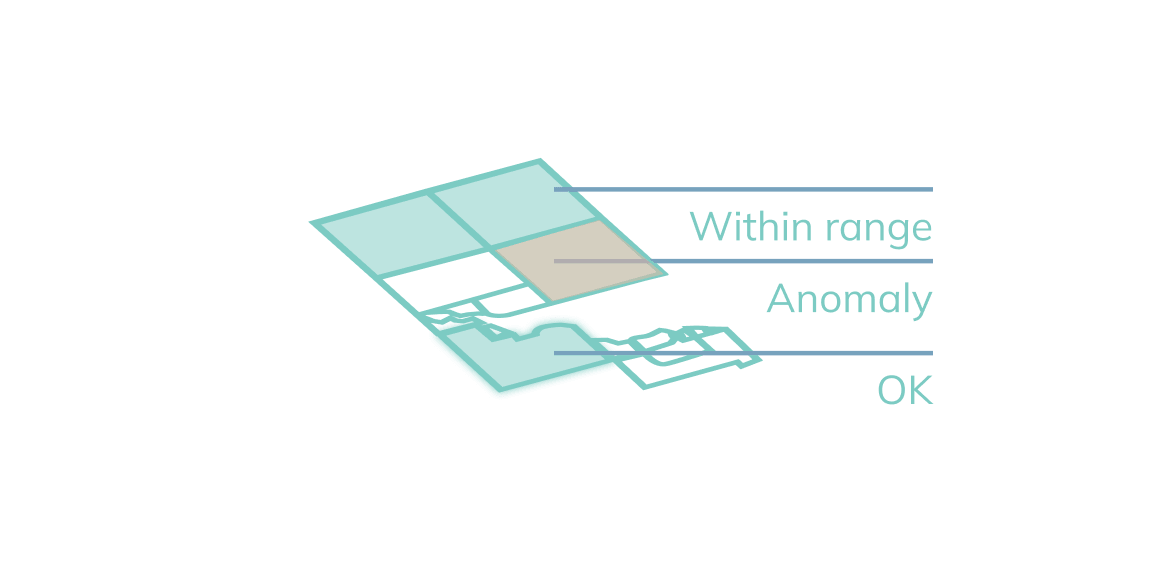
Identify emerging issues at a glance. The HotSpot Processor highlights areas that are changing and may require immediate attention, ensuring developing problems are surfaced quickly.
Automated detection of key crop events including emergence (historical, in-season, and delay detection), greenness readiness, corn silking date (calibrated for Europe), harvest readiness, and harvest detection.
Track Productivity, Benchmark Performance, and Surface Risk
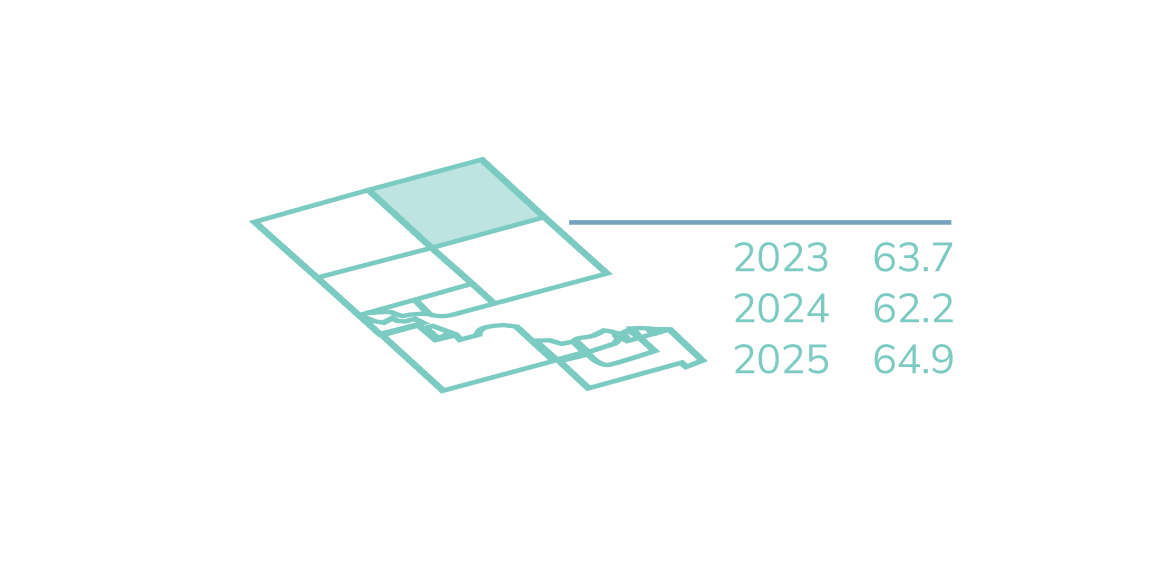
Evaluate how a field performs during the growing season compared to its historical performance for the same crop. Uses satellite imagery time series as a proxy for yield potential, providing a consistent, repeatable benchmark across large portfolios.
Measure how stable or variable a field's performance has been over time by analyzing fluctuations in historical Potential Scores. A score of 20 reflects stable, consistent yields; a score of 65 indicates significant variability and higher production risk.
Compare a field's vegetation development against neighboring fields under similar growing conditions. Quickly identify growth anomalies, distinguish field-specific issues from regional trends, and prioritize where deeper investigation is needed.
Compare growth development across a defined set of fields to identify top performers and highlight those falling behind. Advisors can quickly see which fields require immediate attention and which are tracking as expected.
Ingest EarthDaily data directly into your systems to feed yield forecast models or power custom interfaces.
Digital Ag leverages both public and private satellite constellations to ensure reliable, scalable coverage across agricultural regions worldwide.
Brazil:
Instant visibility across every field in your portfolio. Prioritize interventions with objective data, justify recommendations with satellite-verified evidence, and intervene proactively when conditions shift.
Power digital farming tools, agronomic models, and crop-specific advisory services with standardized, API-accessible field-level datasets.
AI-ready datasets feed directly into modeling pipelines. Curated indicators and field-level metrics reduce preprocessing time and accelerate experimentation.
Deeper, more consistent insight into field performance than traditional scouting alone. Support growers with data-driven guidance on input adjustments and timing.
Scale your practice with portfolio-wide monitoring that flags the fields needing attention, so you spend time where it matters most.
Speak directly with EarthDaily crop analysts about potential yield concerns. Bring your own questions or let analysts guide you through a virtual crop tour of regions relevant to your business.
Portfolio-Wide Monitoring:
Crop condition insights across your entire operation
Biophysical Variables:
Canopy structure, nitrogen uptake, water stress, and light-use efficiency indicators
Multi-Index Analytics:
NDVI, EVI, GCVI, GNDVI, LAI, NDWI, and NMDI for detailed condition assessment
Historical Time Series:
Medium-resolution from 2019; low-resolution from 2003
Automated Phenology Detection:
Emergence, peak vegetation, silking, harvest readiness, and harvest detection
Spatial Change Detection:
Near real-time identification of shifting field conditions
Field Benchmarking and Ranking:
Performance comparison against neighbors and portfolio peers
Weather Integration:
Daily and cumulative weather indicators with historical comparison
In-Field Variability Maps:
Vigor, nutrition, moisture, and canopy structure at sub-field resolution
Soil and Terrain Context:
Integrated soil maps (SSURGO for U.S.) and elevation/slope models
Management Zone Generation:
Prescription (Rx) maps for variable-rate input applications
Multiple options: automated field creation, boundary selection layers (in select regions), or upload your existing field boundaries. Analytics begin computing immediately after onboarding.
A comprehensive suite including NDVI, EVI, GNDVI, LAI, Biomass, S2REP, NDRE, NDMI, FAPAR, and FCover, covering canopy development, nitrogen nutrition, water stress, and photosynthetic activity.
10+ years of medium-resolution time series history. Low-resolution (MODIS) archives back to 2003 for long-term benchmarking and trend analysis.
Contact EarthDaily to schedule a demo and discuss your specific requirements. Whether you need platform access, API integration, or both, our team can tailor a solution to your workflow.