
Data & imagery

EarthDaily data

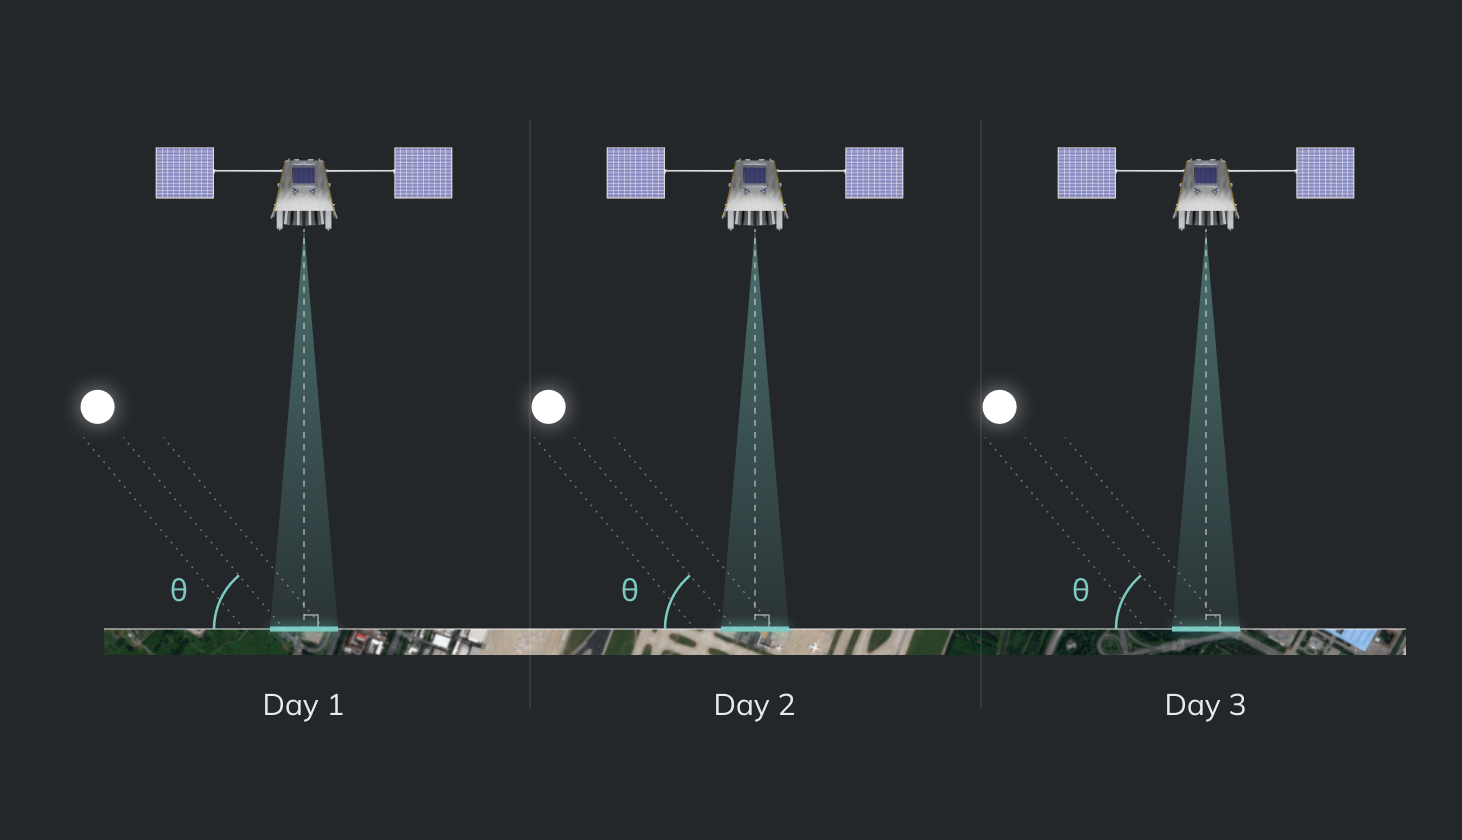
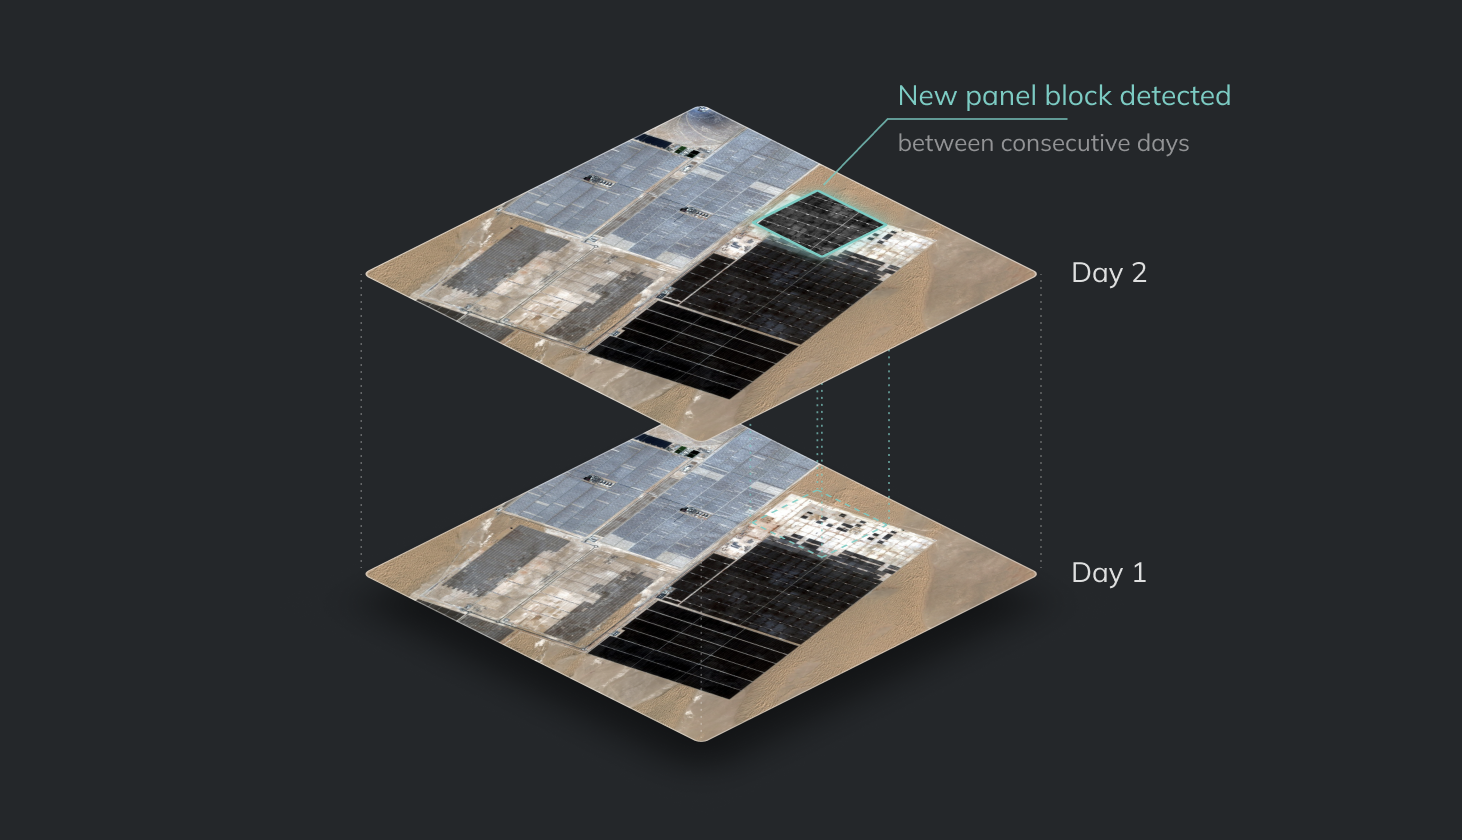
The EarthDaily Constellation images the planet every day at the same solar time and viewing angle. Because capture conditions stay the same, the ground is what changes between images. You get a consistent time series that is ready for automated change detection.

Day pass — VNIR, SWIR and TIR

What, how, and when we collect

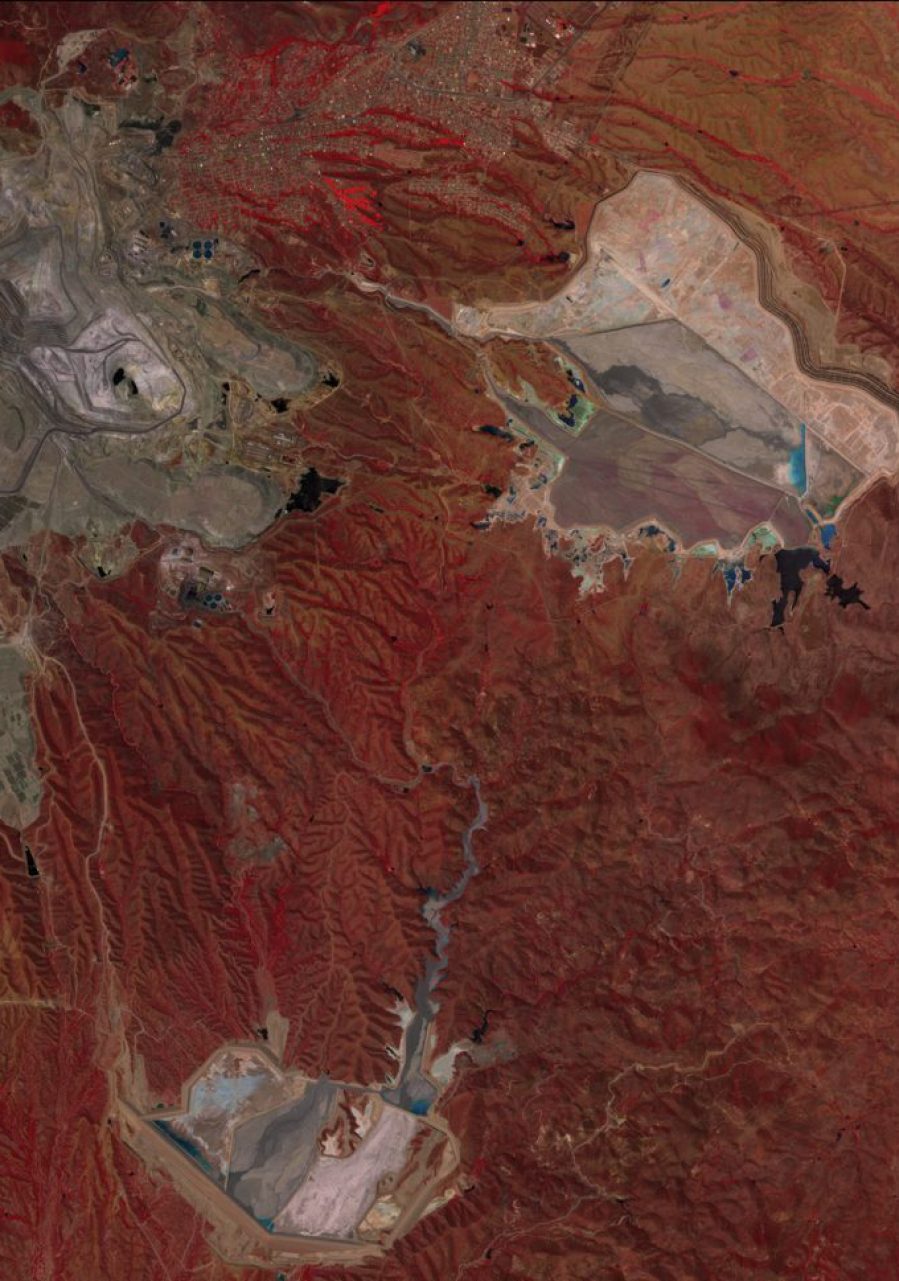
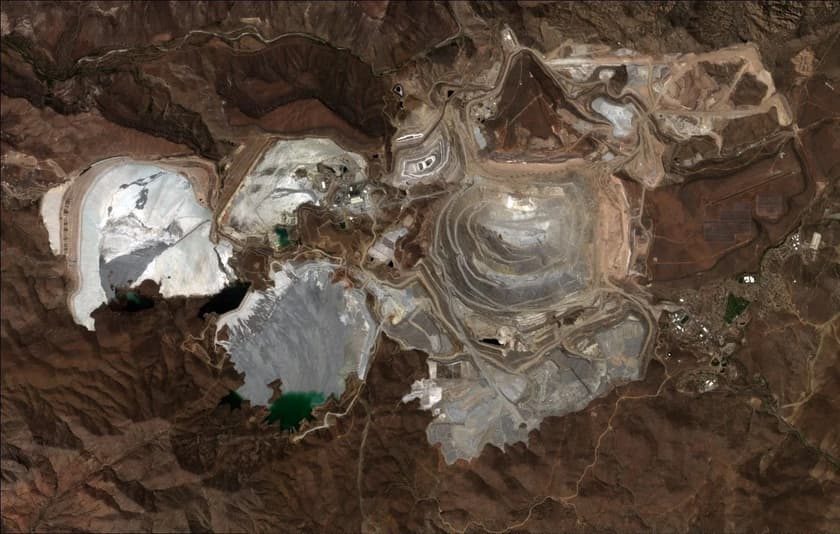
  • Cananea, Mexico, near-infrared false colour

    What

    We collect wide-swath imagery across 22 calibrated spectral bands and calibrate every capture.

    Cananea, Mexico · near-infrared false colour
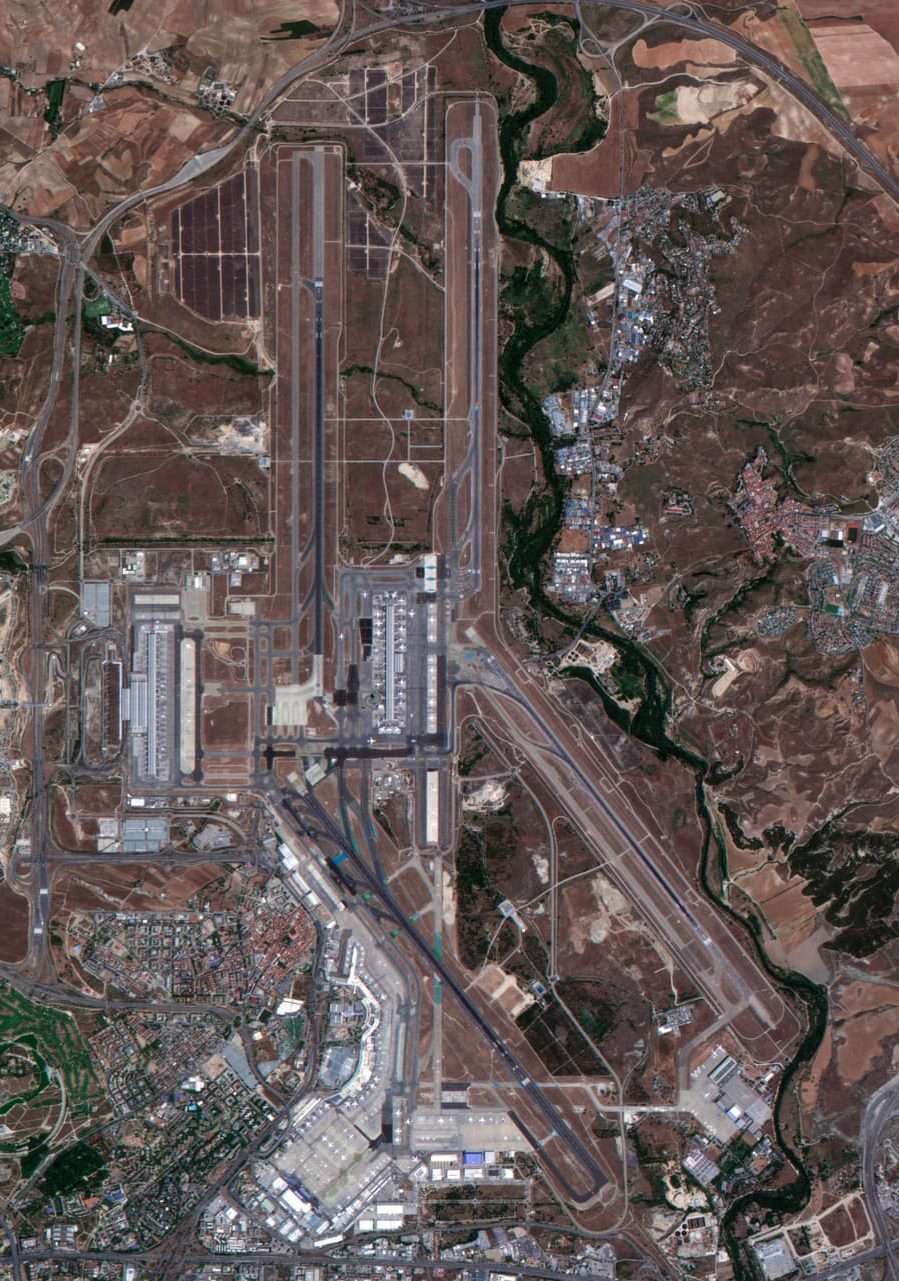
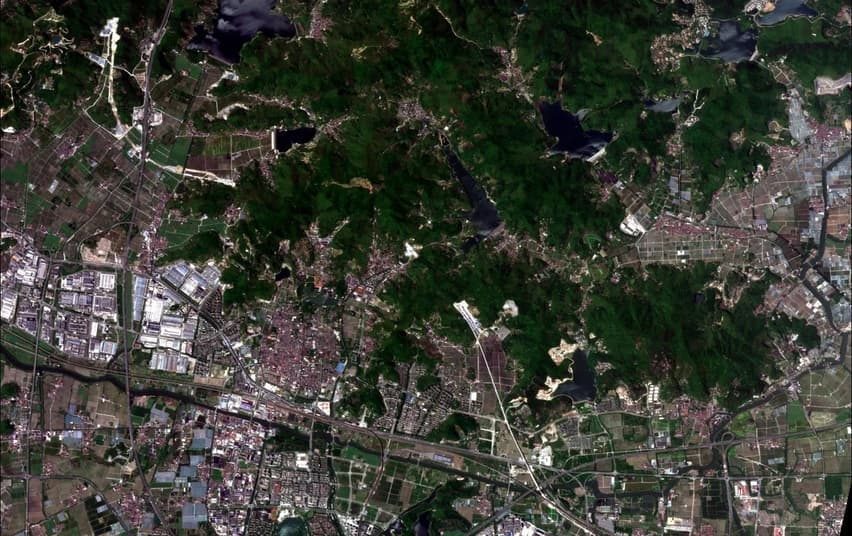
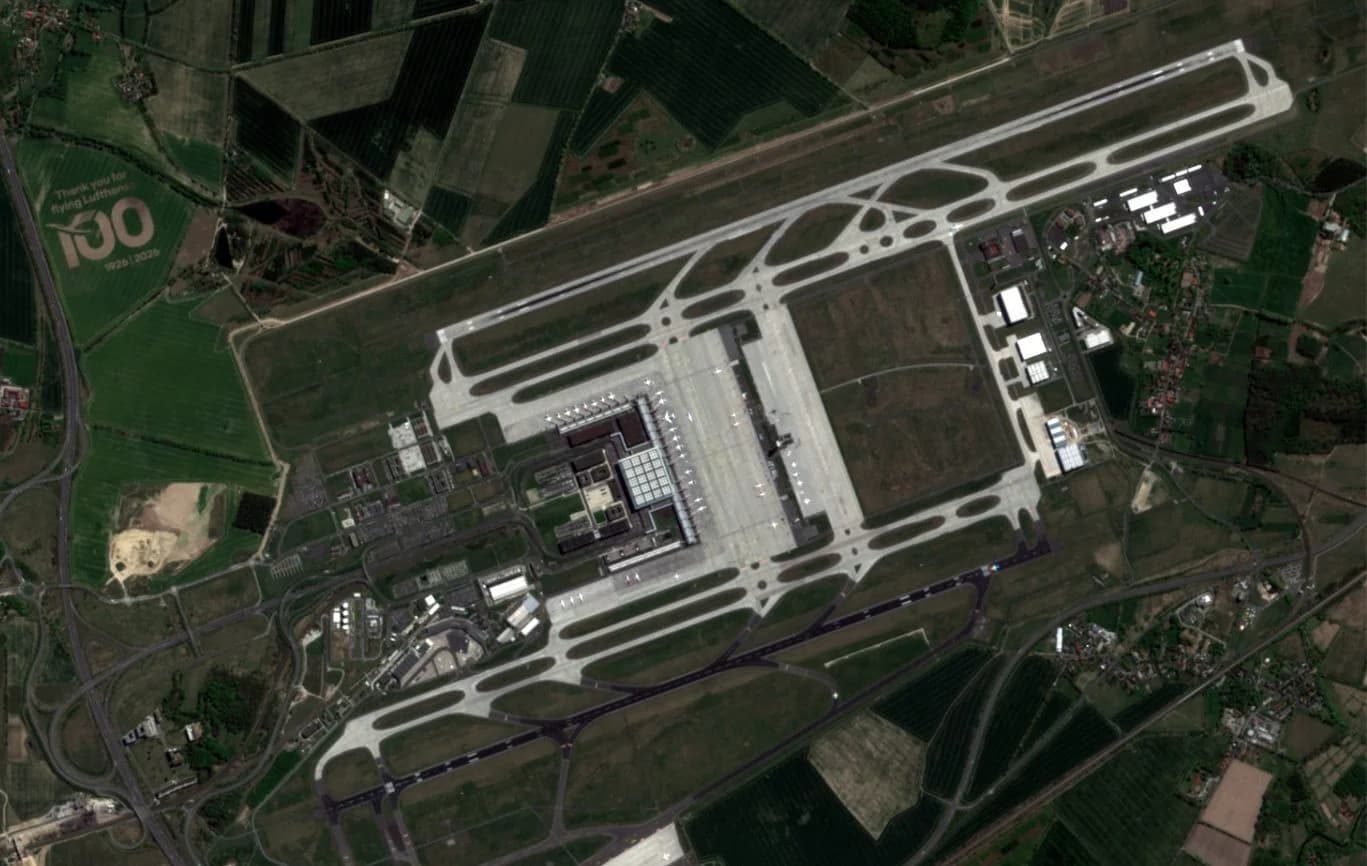
  • Satellite image showing consistent capture geometry

    How

    We use the same orbits, altitudes, viewing angles, sensors, and satellites for every capture, so images stay consistent day to day.
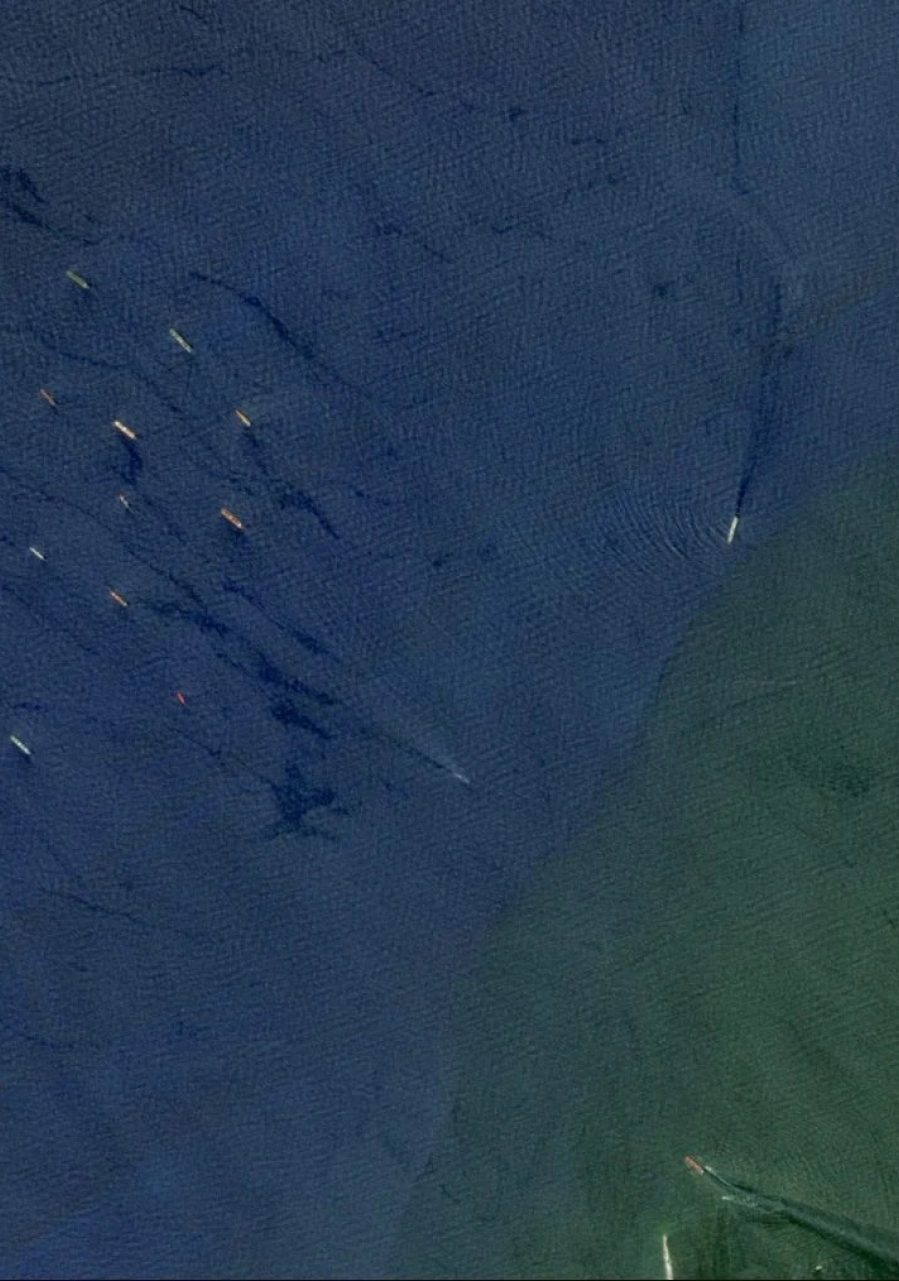
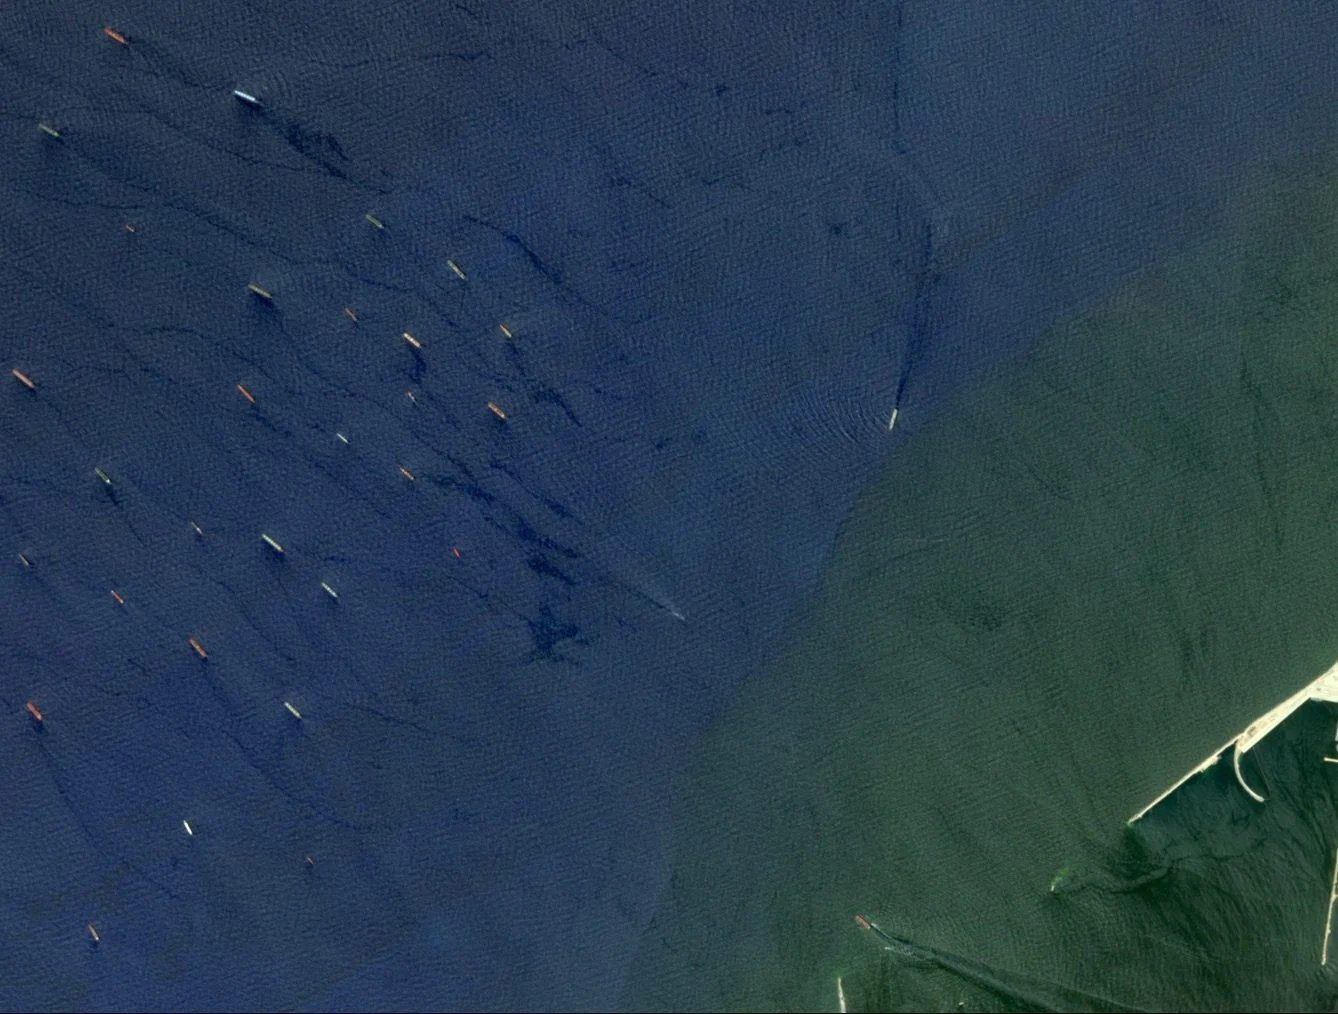
  • Alexandria, Egypt, vessels at anchor

    When

    We collect nadir images at the same solar time each day, aligned to the images before them.

    Alexandria, Egypt · vessels at anchor

Data quality

Four properties of a consistent time series

Daily imagery is useful when each image lines up with the one before it. We engineer geolocation, geometry, radiometry, and revisit together, so differences between images reflect changes on the ground and your models get a consistent signal to work from.

Together, these four properties give you a consistent, AI-ready time series for automated change detection. Each example below shows them at work.

Time series

A growing season in images

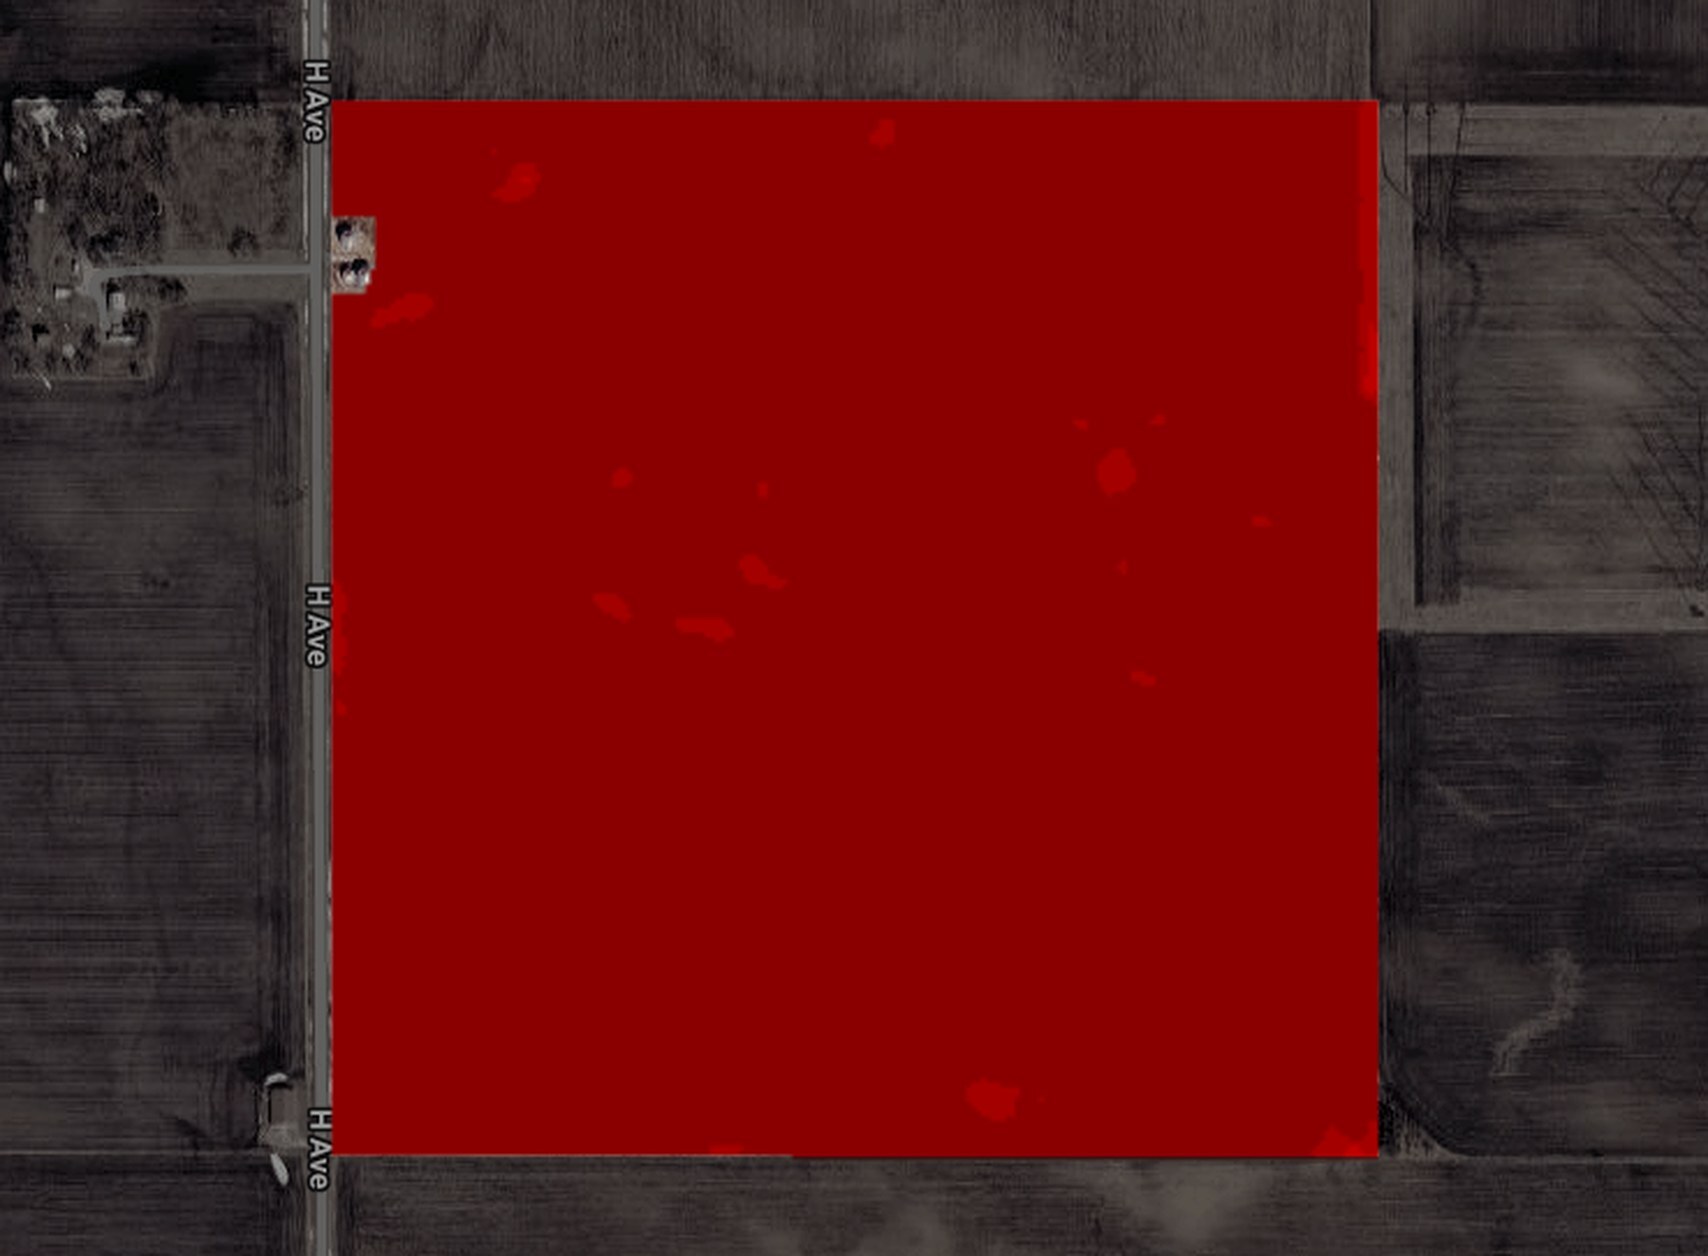
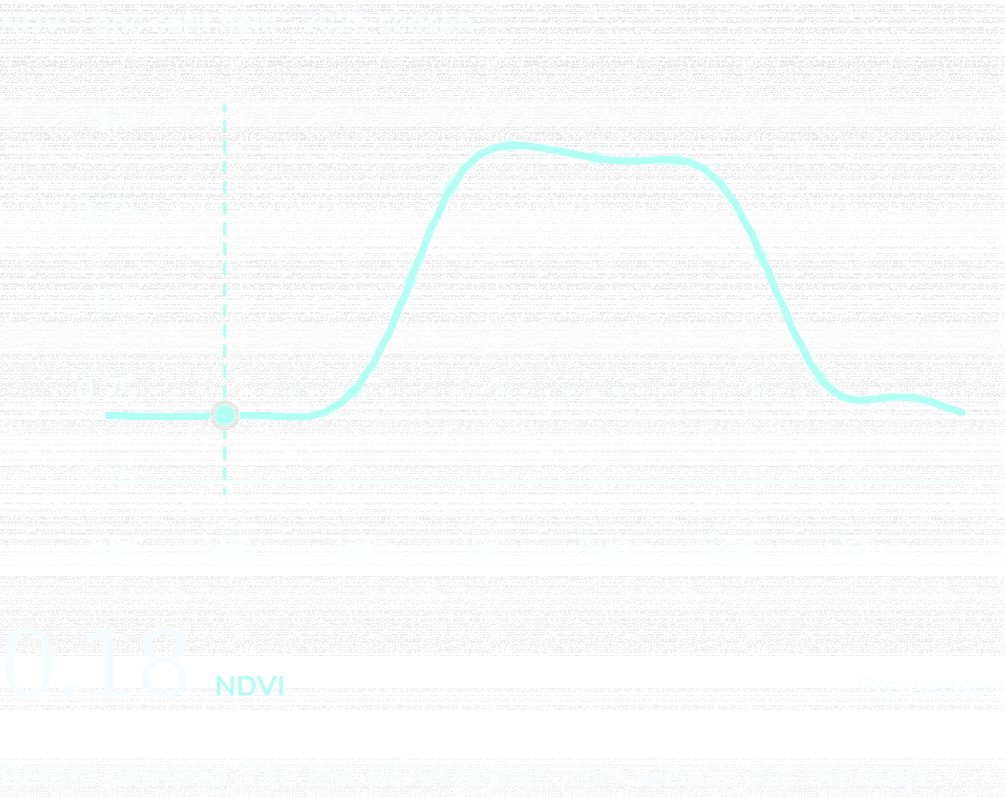
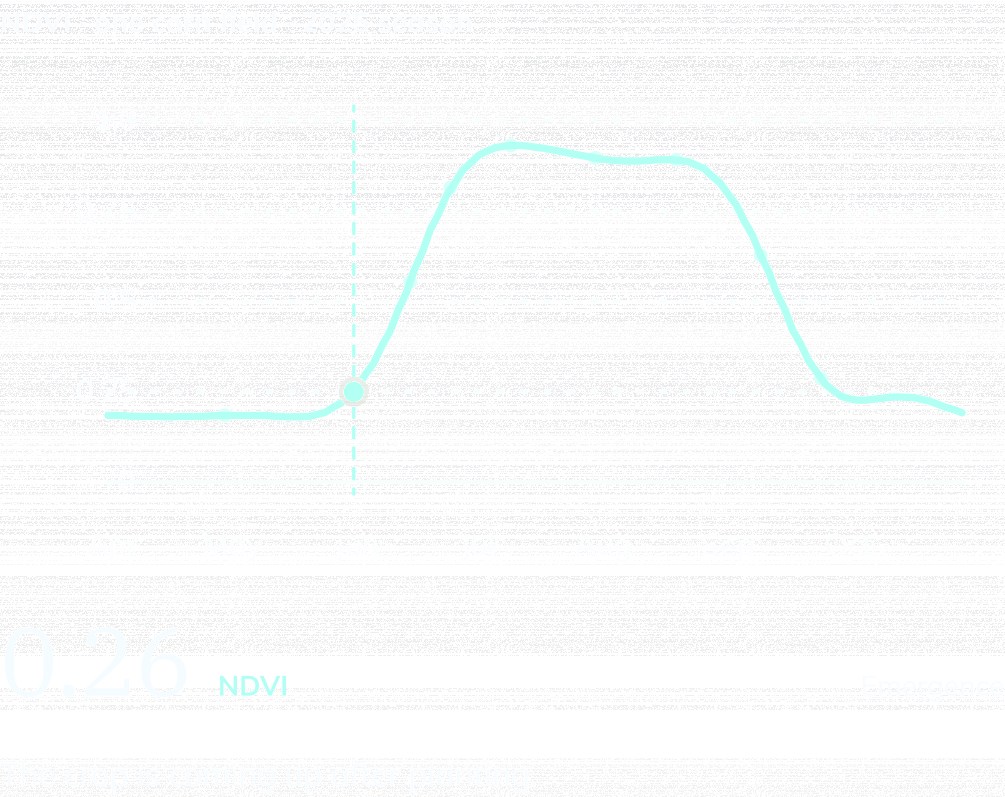
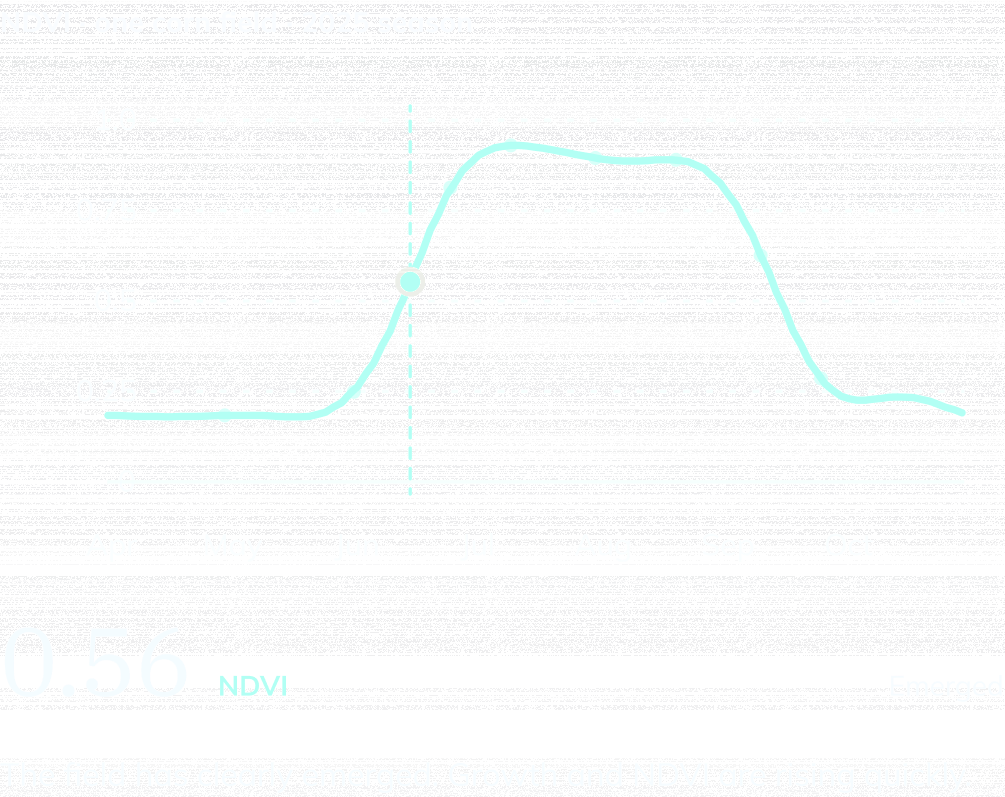
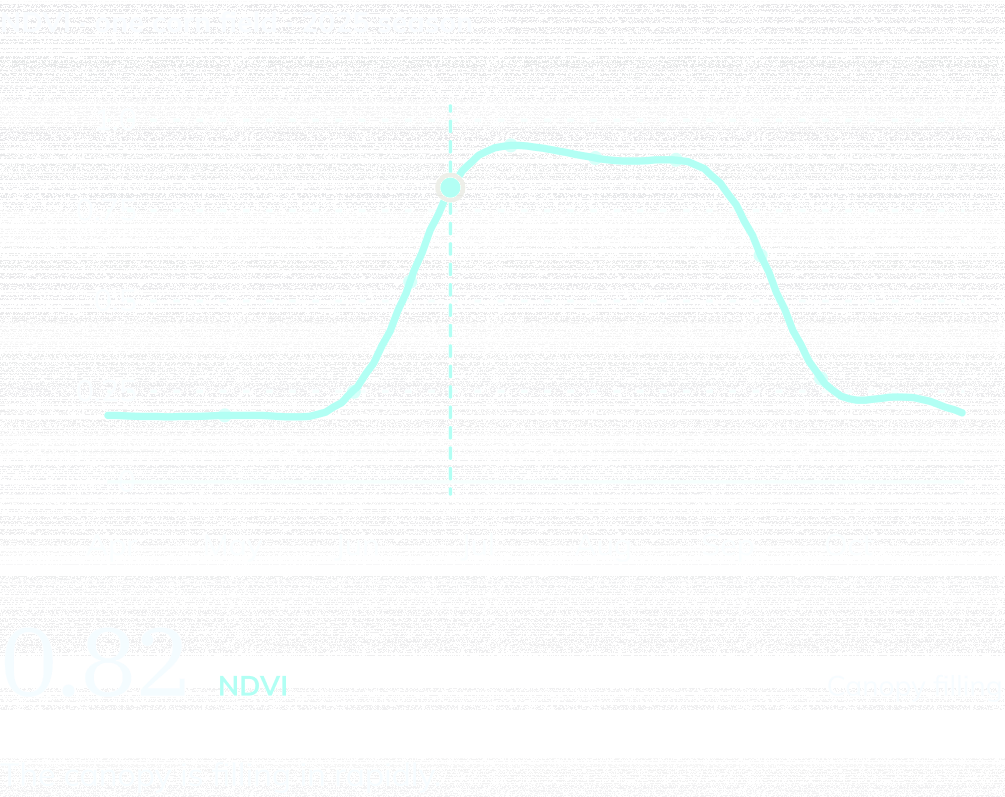
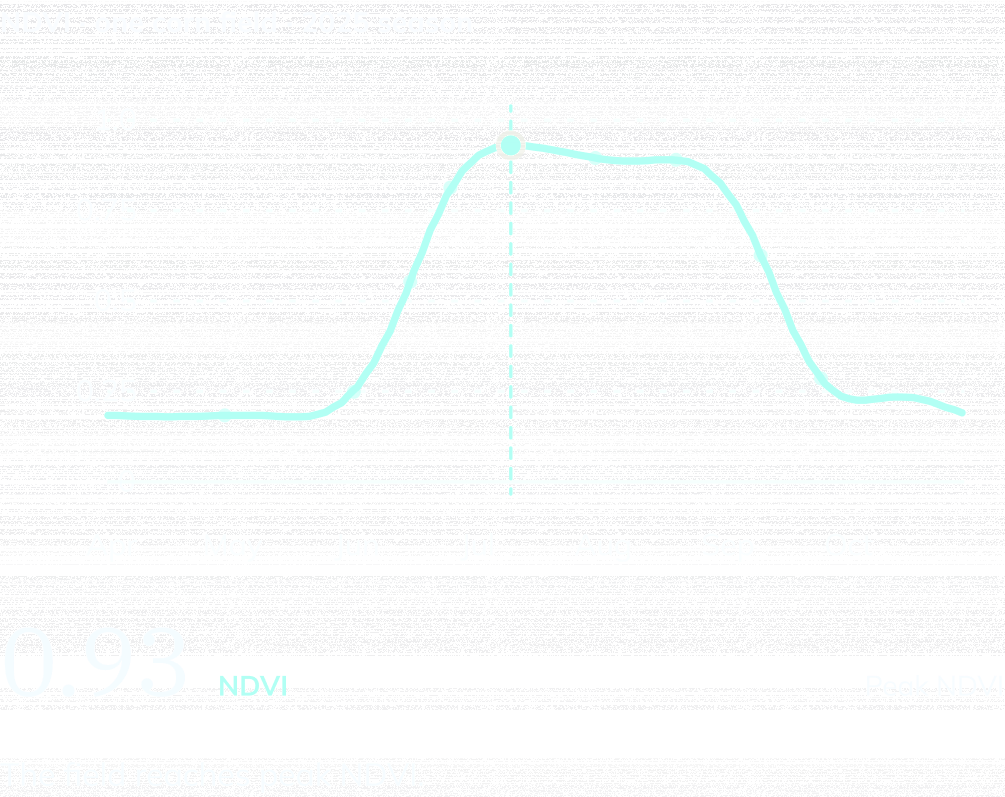
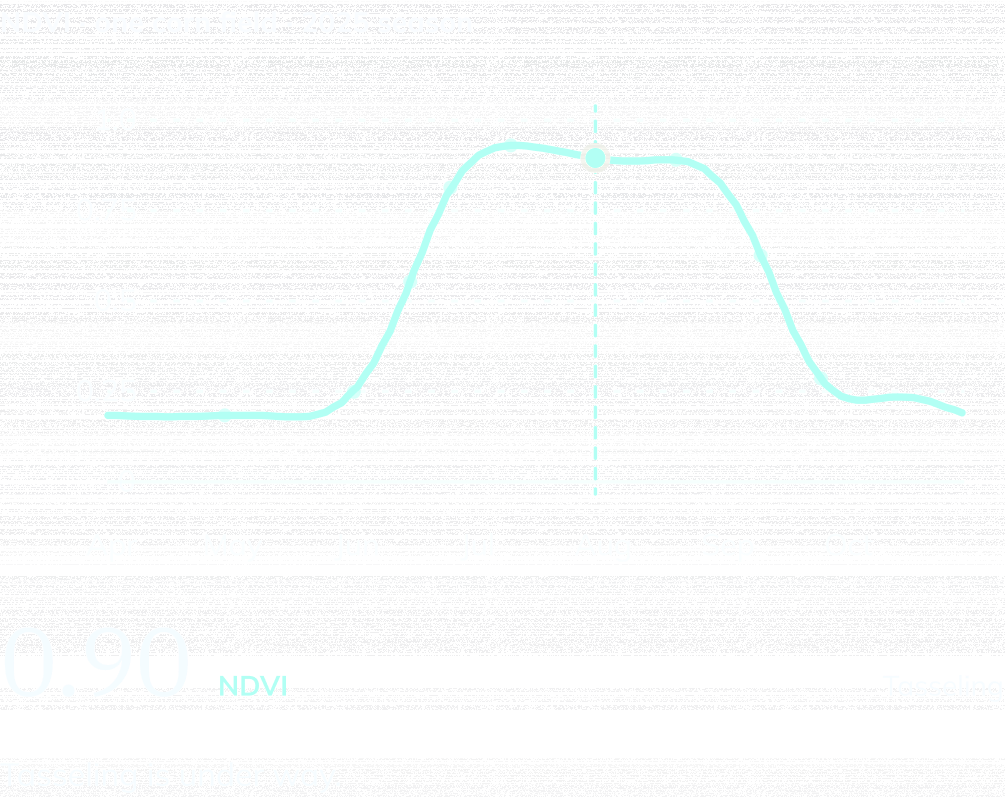
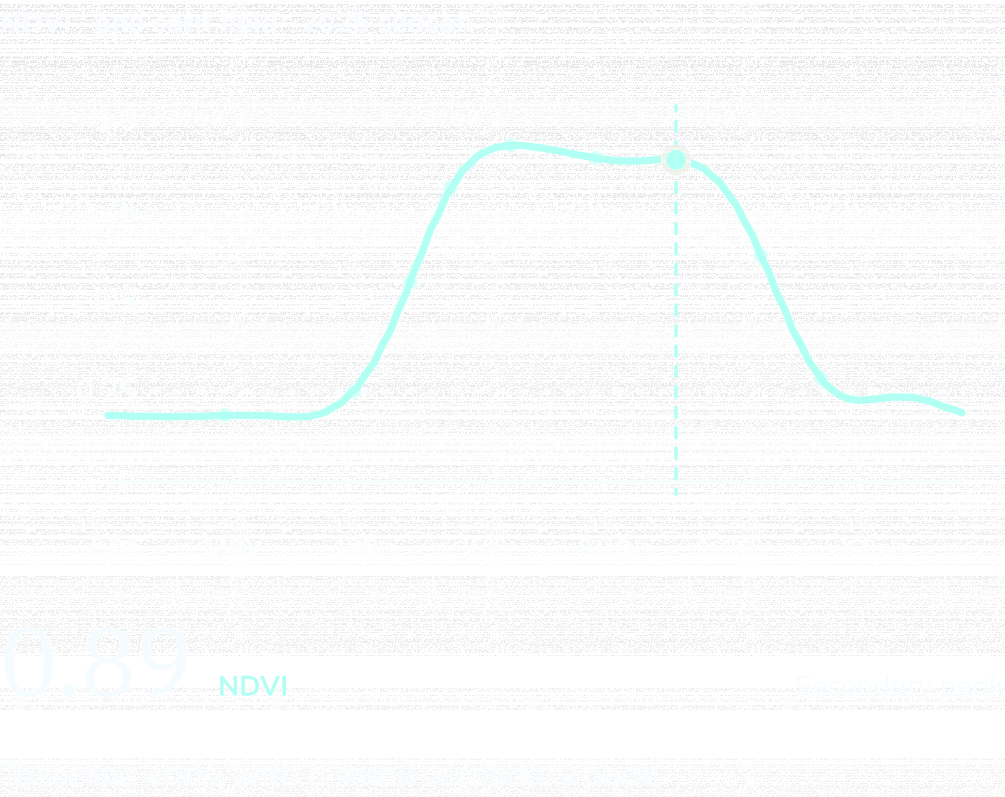
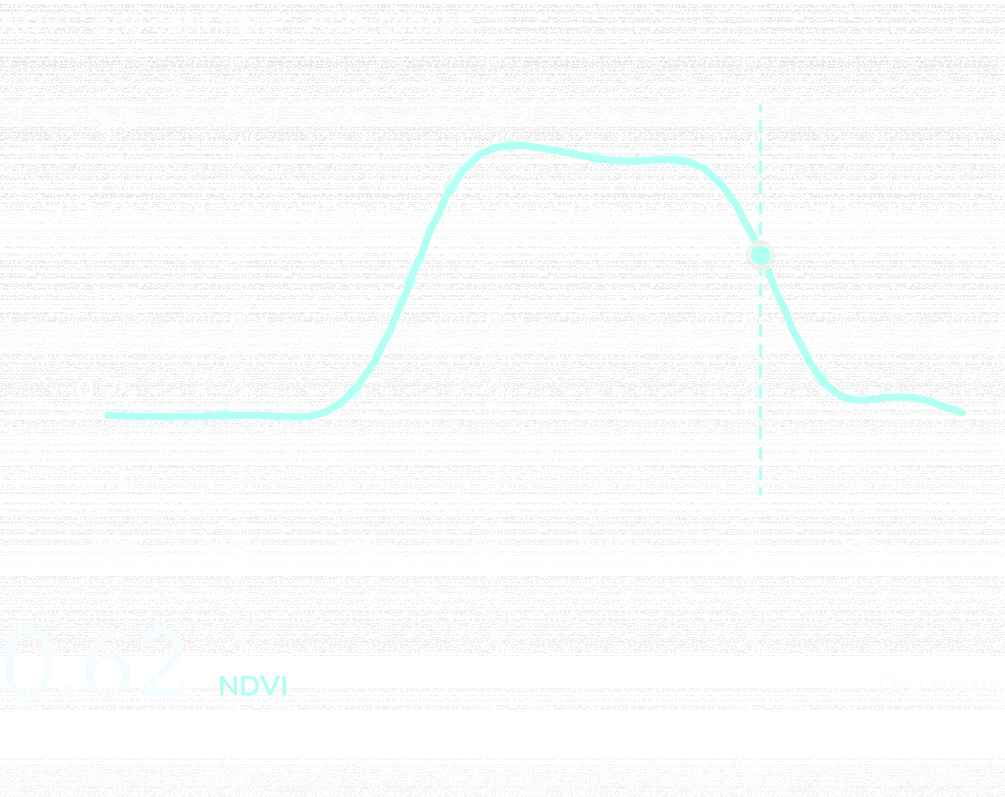
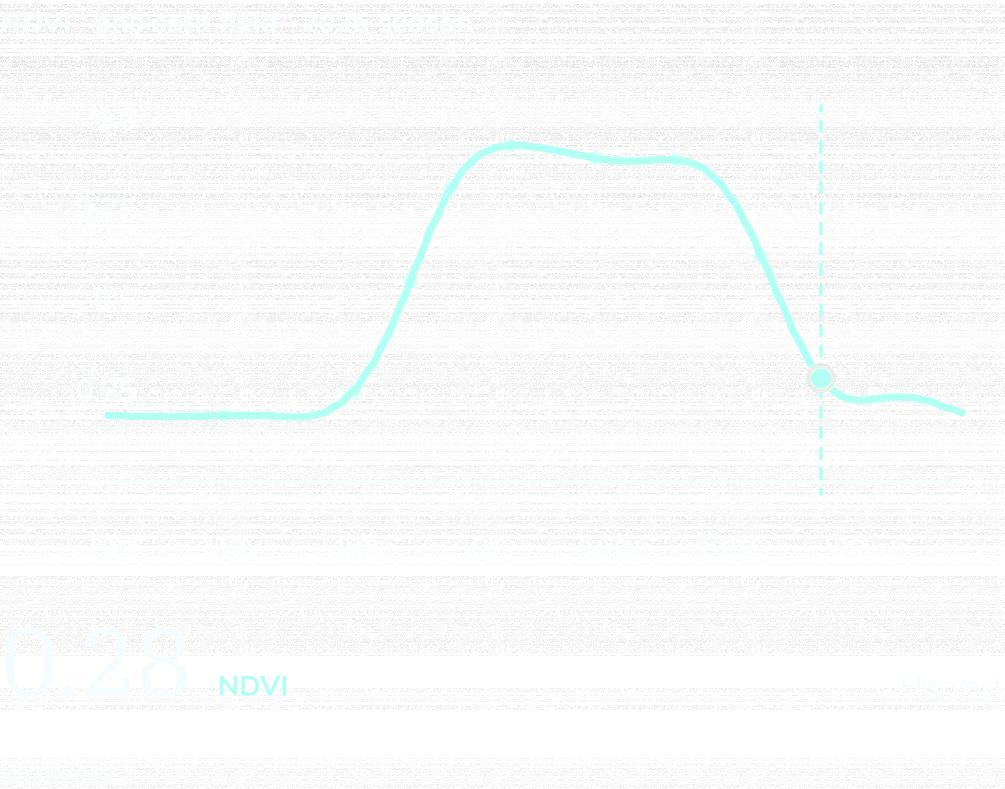
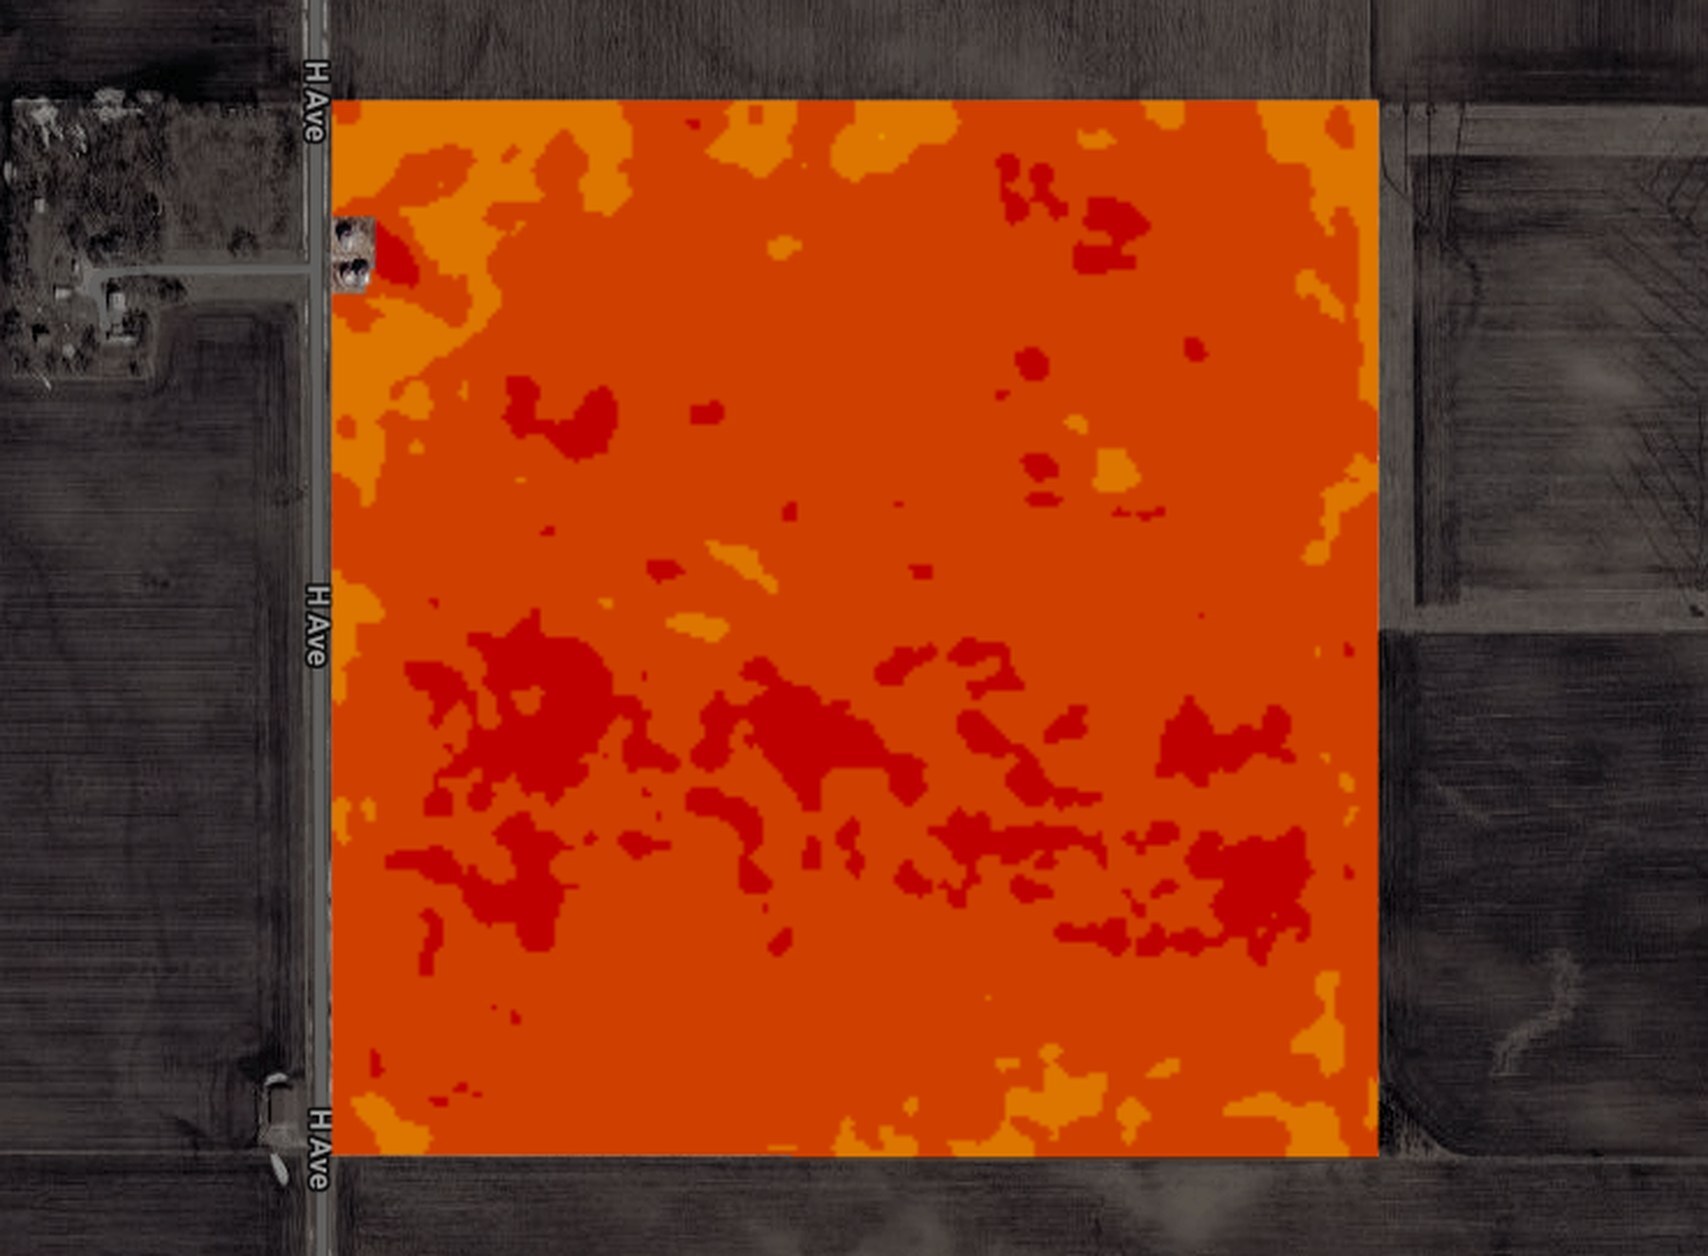
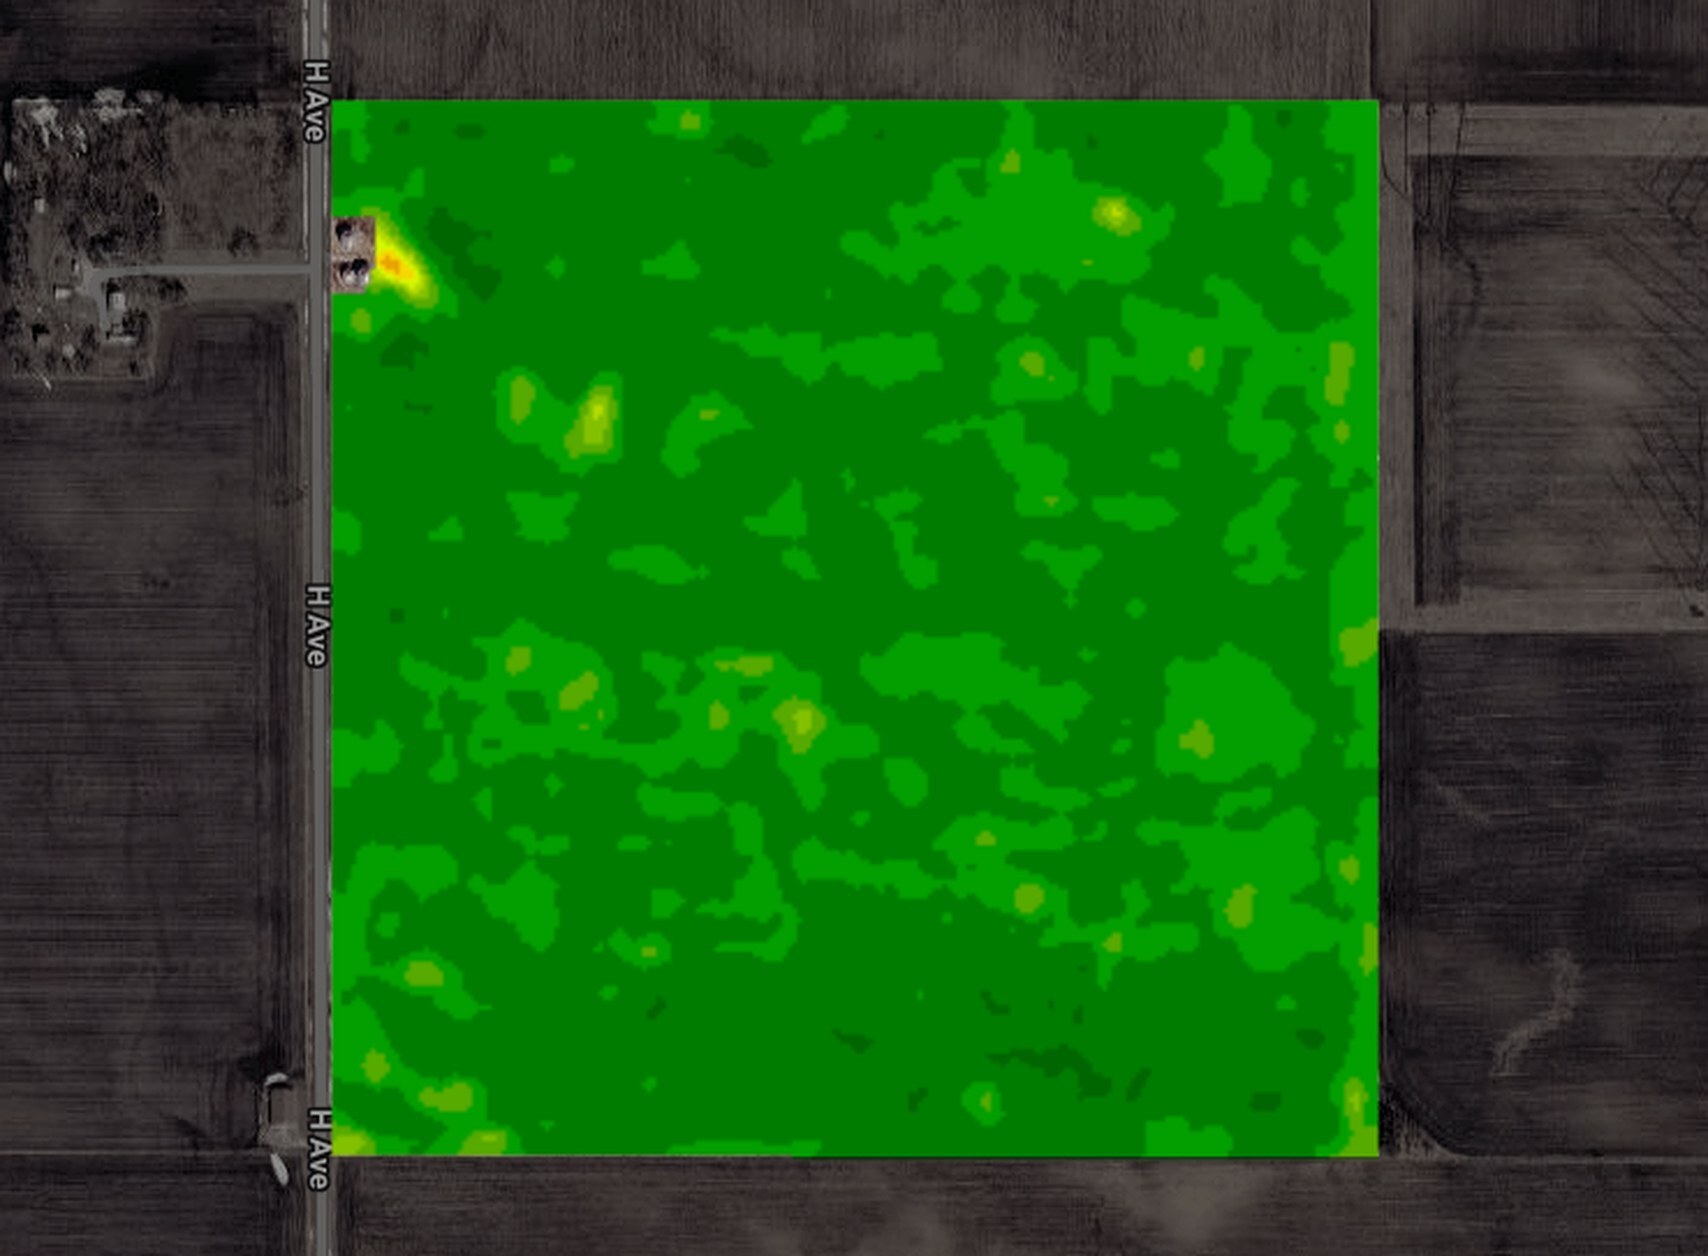
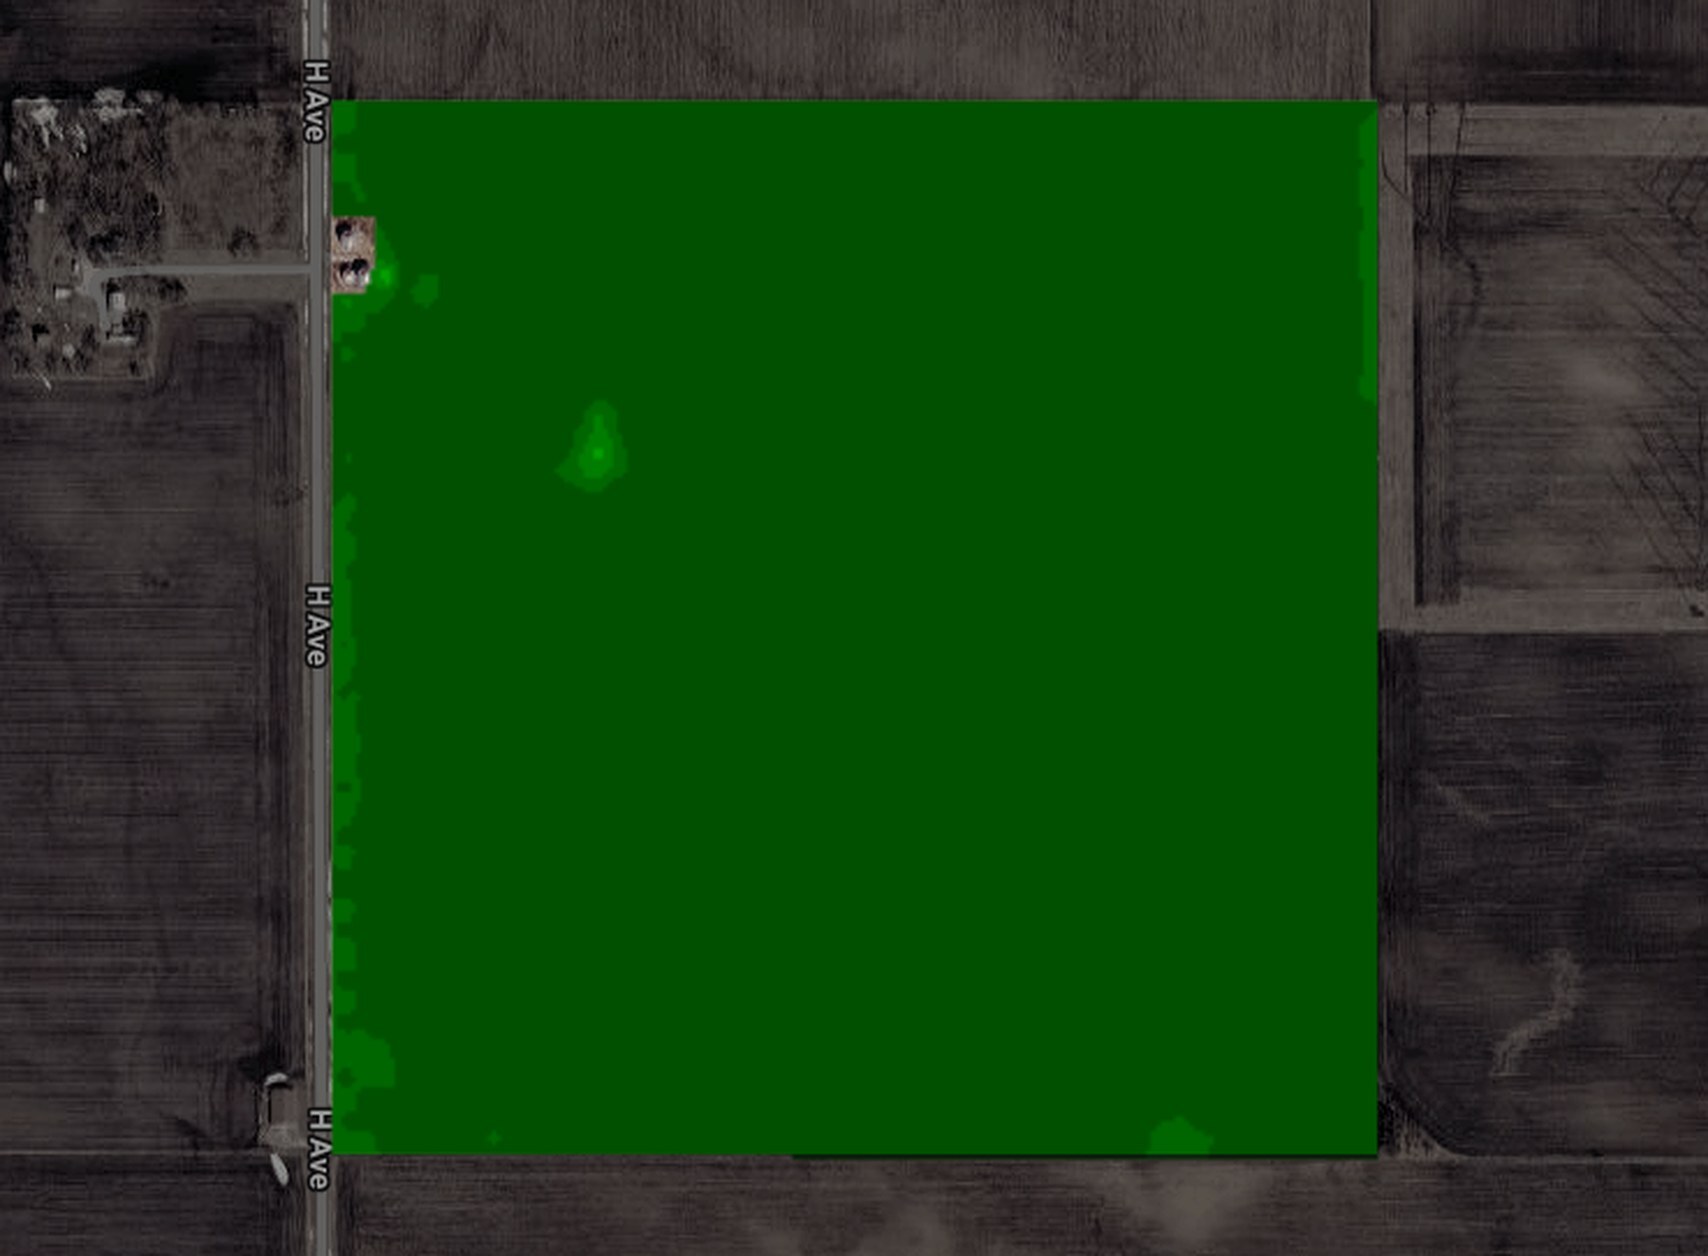
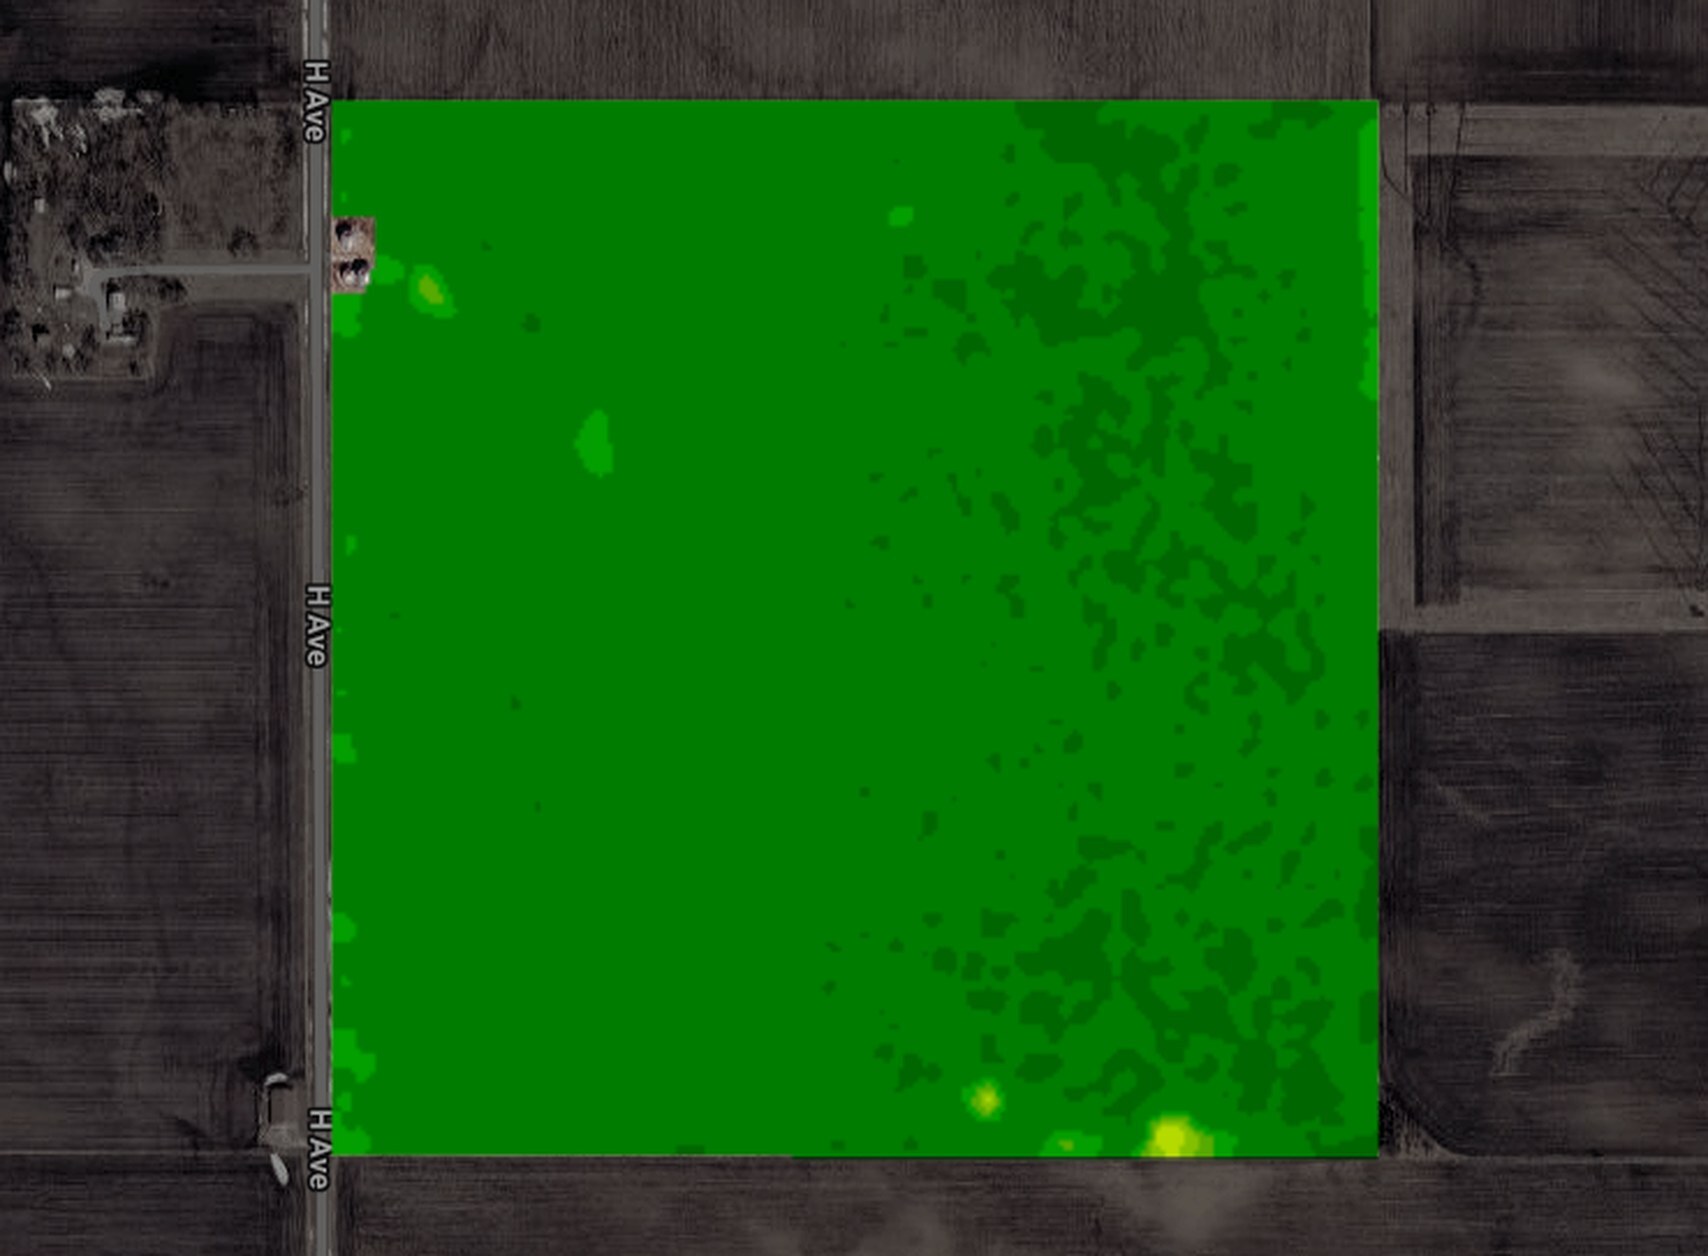
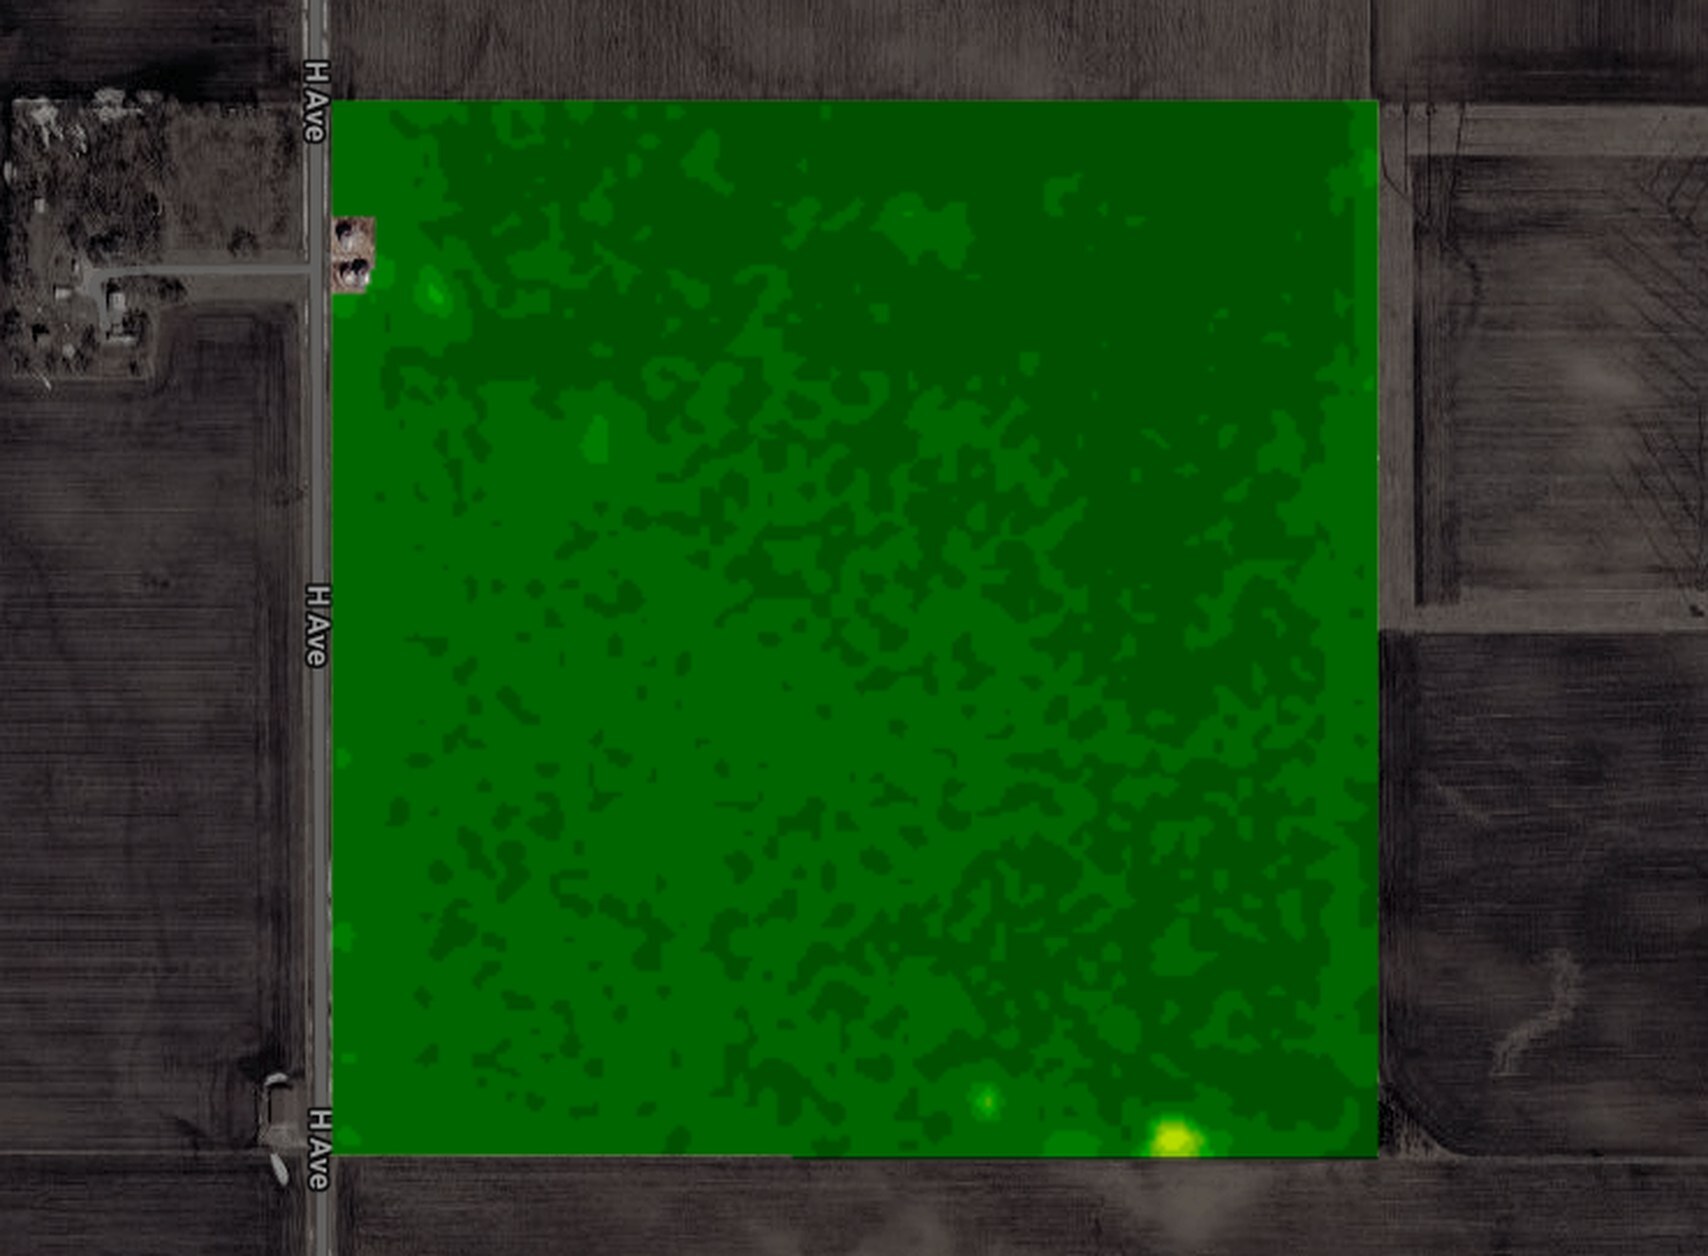
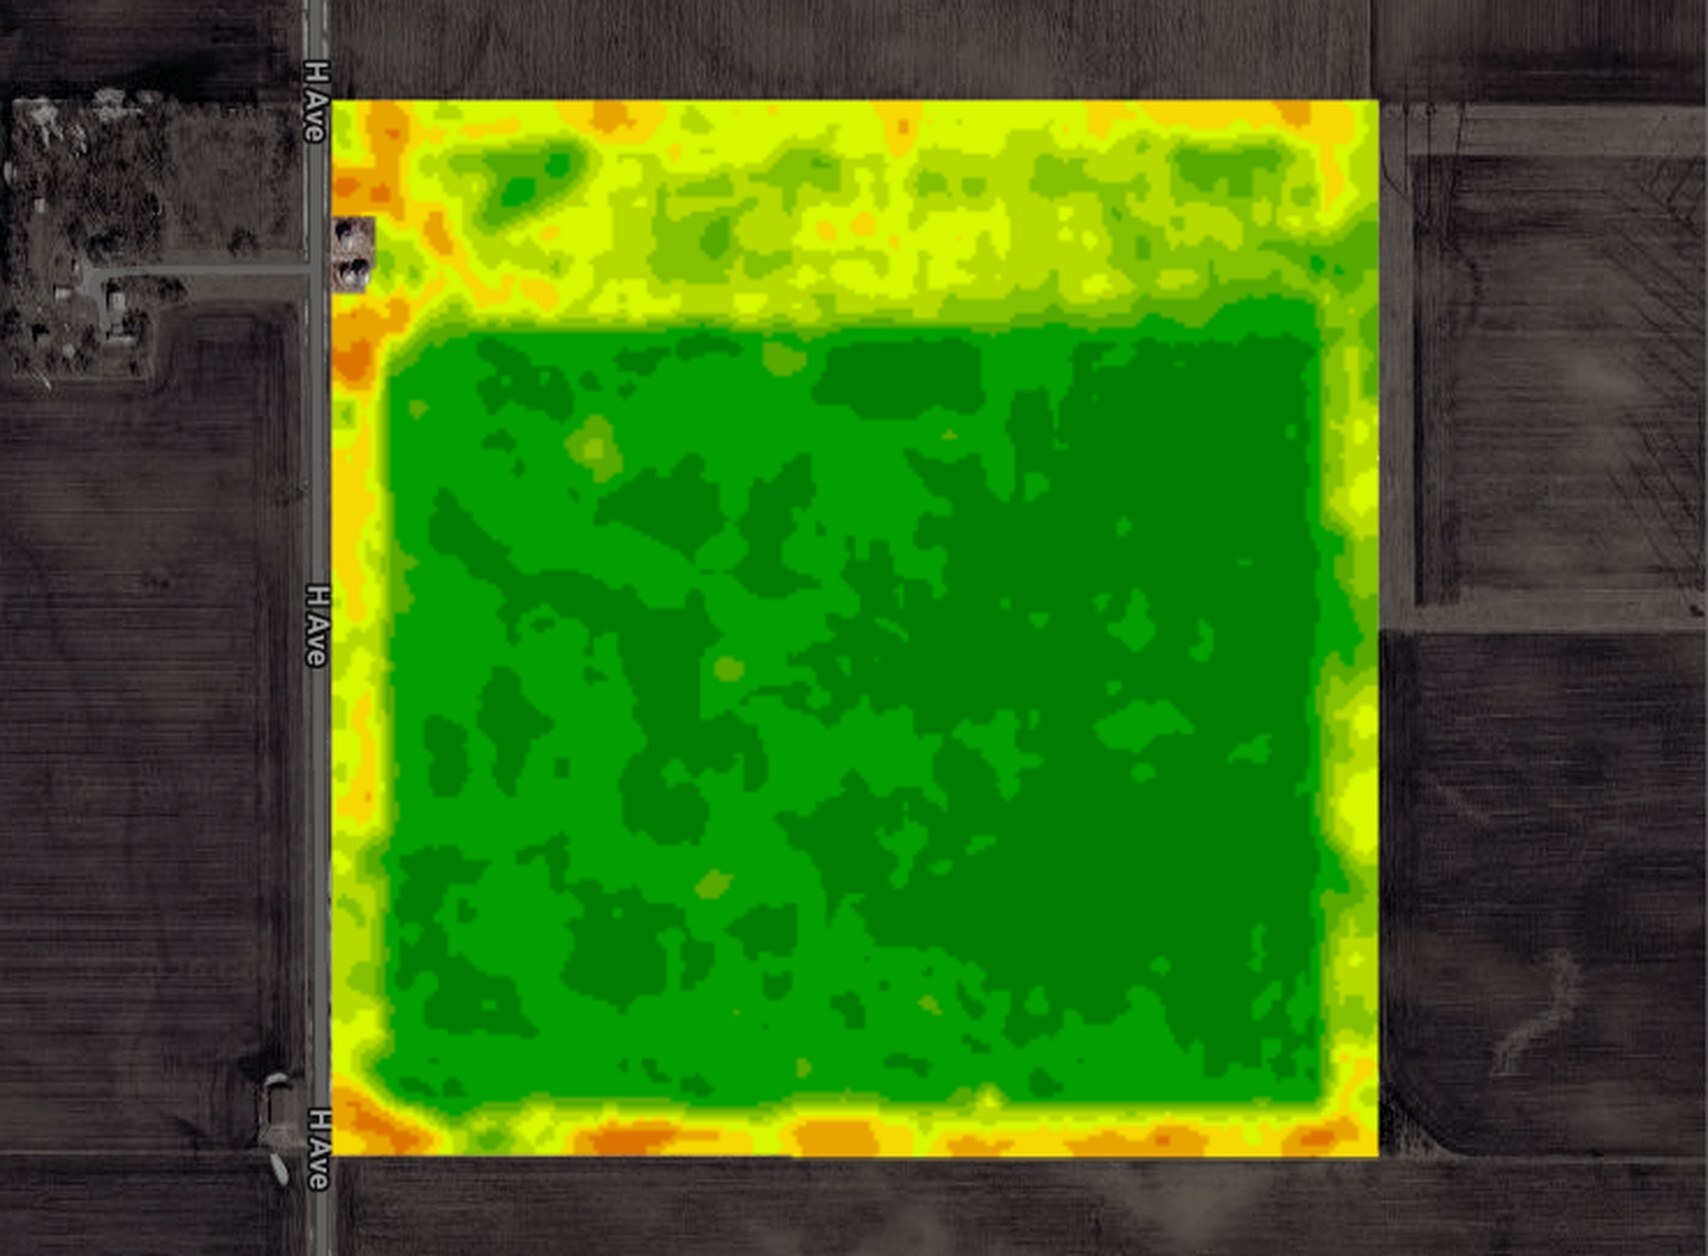
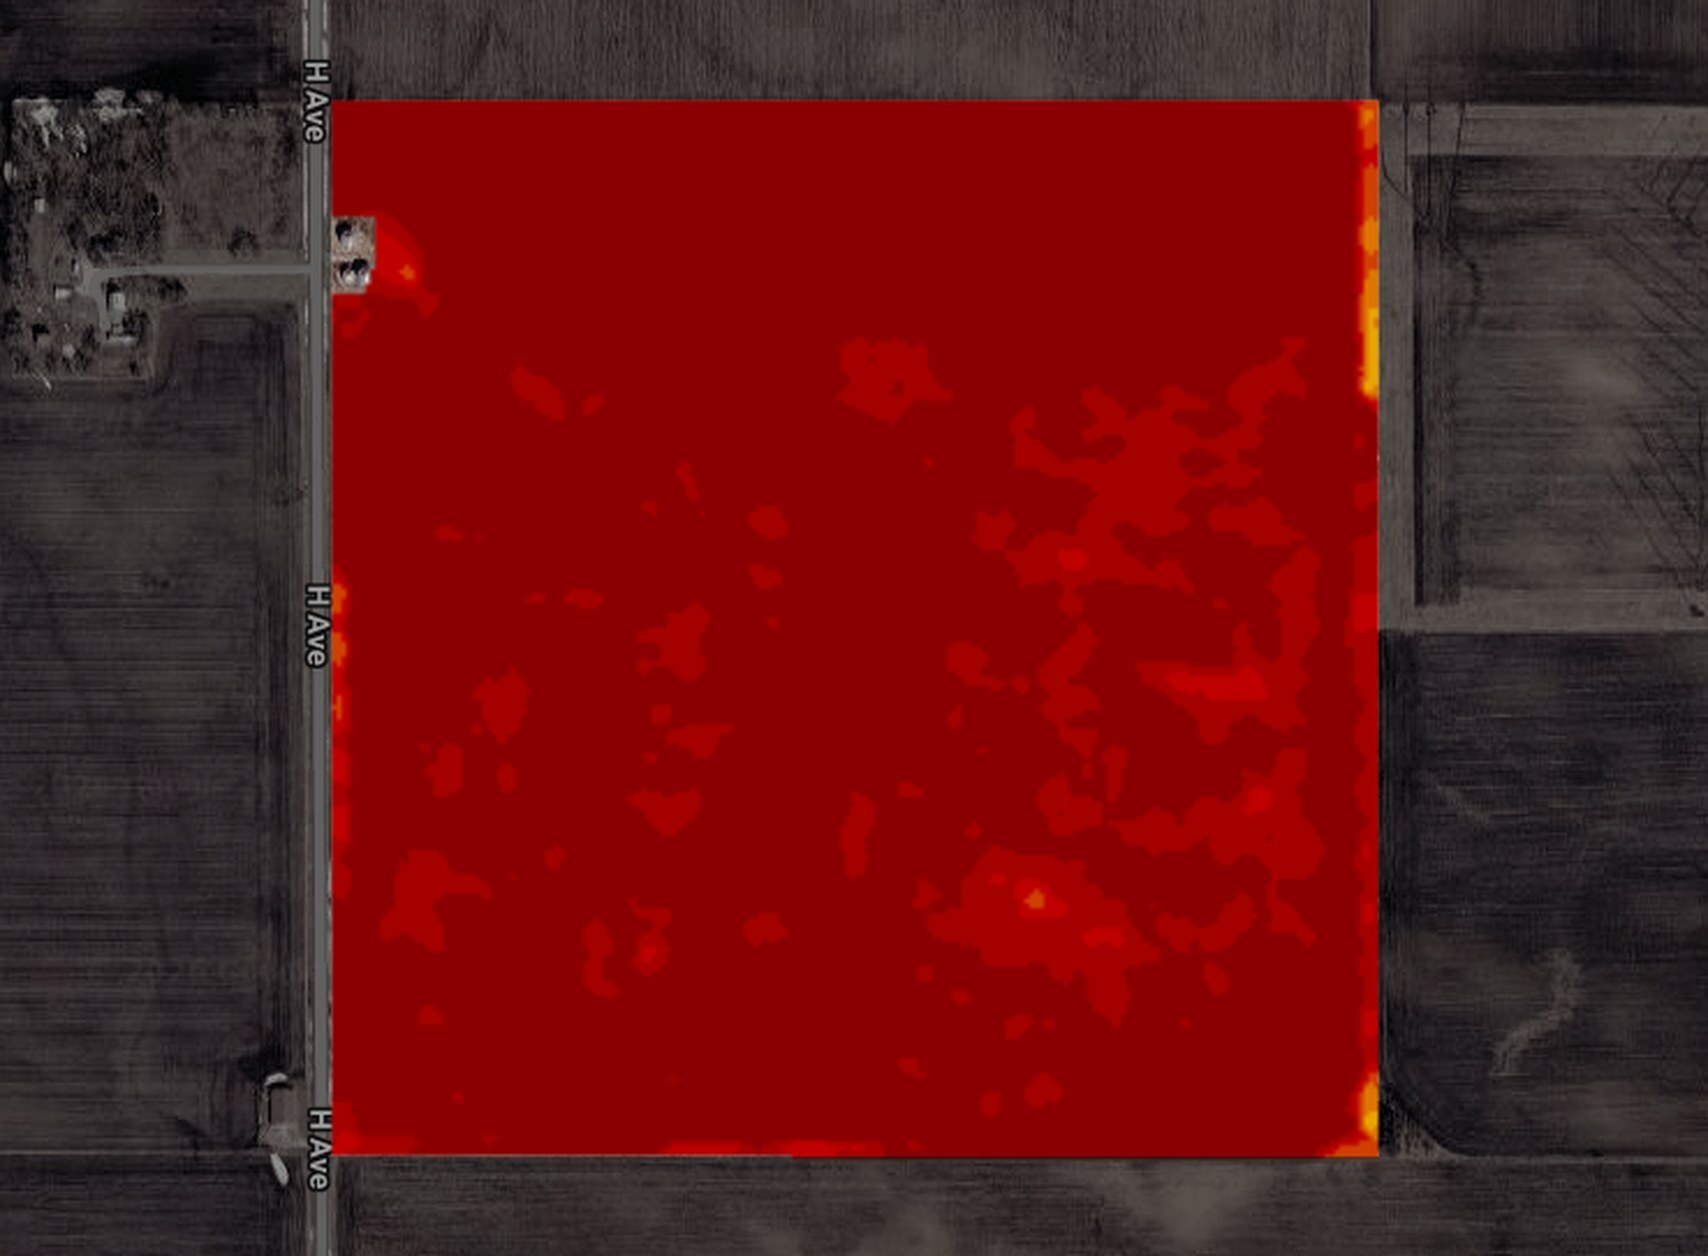
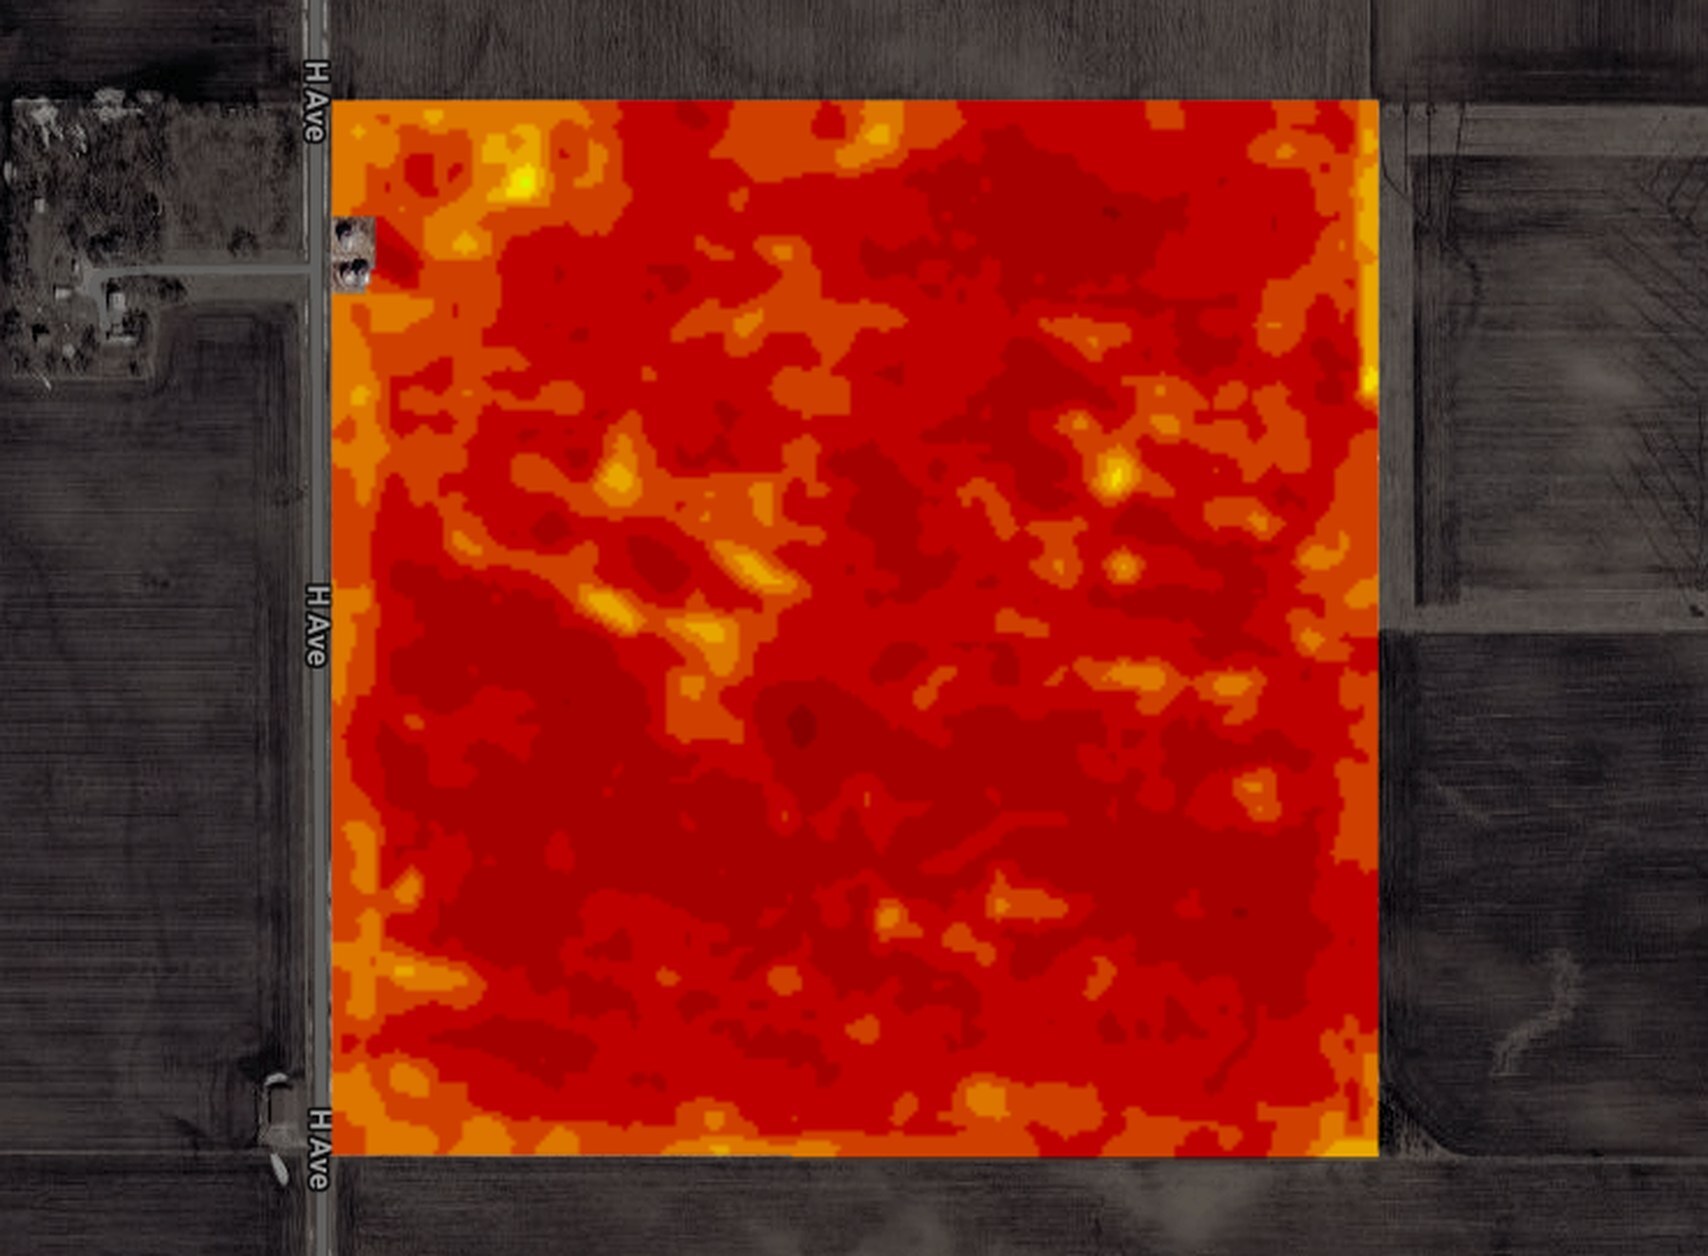
Scrub through one Iowa corn field across the 2025 season, shown as NDVI. The frame stays fixed on the same ground while the crop moves from bare soil through emergence, peak, tasseling and dry down to harvest.

One Iowa corn field in NDVI on Apr 30, 2025: pre-season, NDVI 0.18
Region
Iowa · Corn Belt
Layer
NDVI
Date
Apr 30
NDVI
0.18

Same frame · pixels locked

NDVI curve for one Iowa corn field, April to October 2025, marked at Apr 30: NDVI 0.18, Pre-season. Before planting. The low NDVI comes from weeds, not the crop.

Temporal frequency

Daily revisit and consistent capture

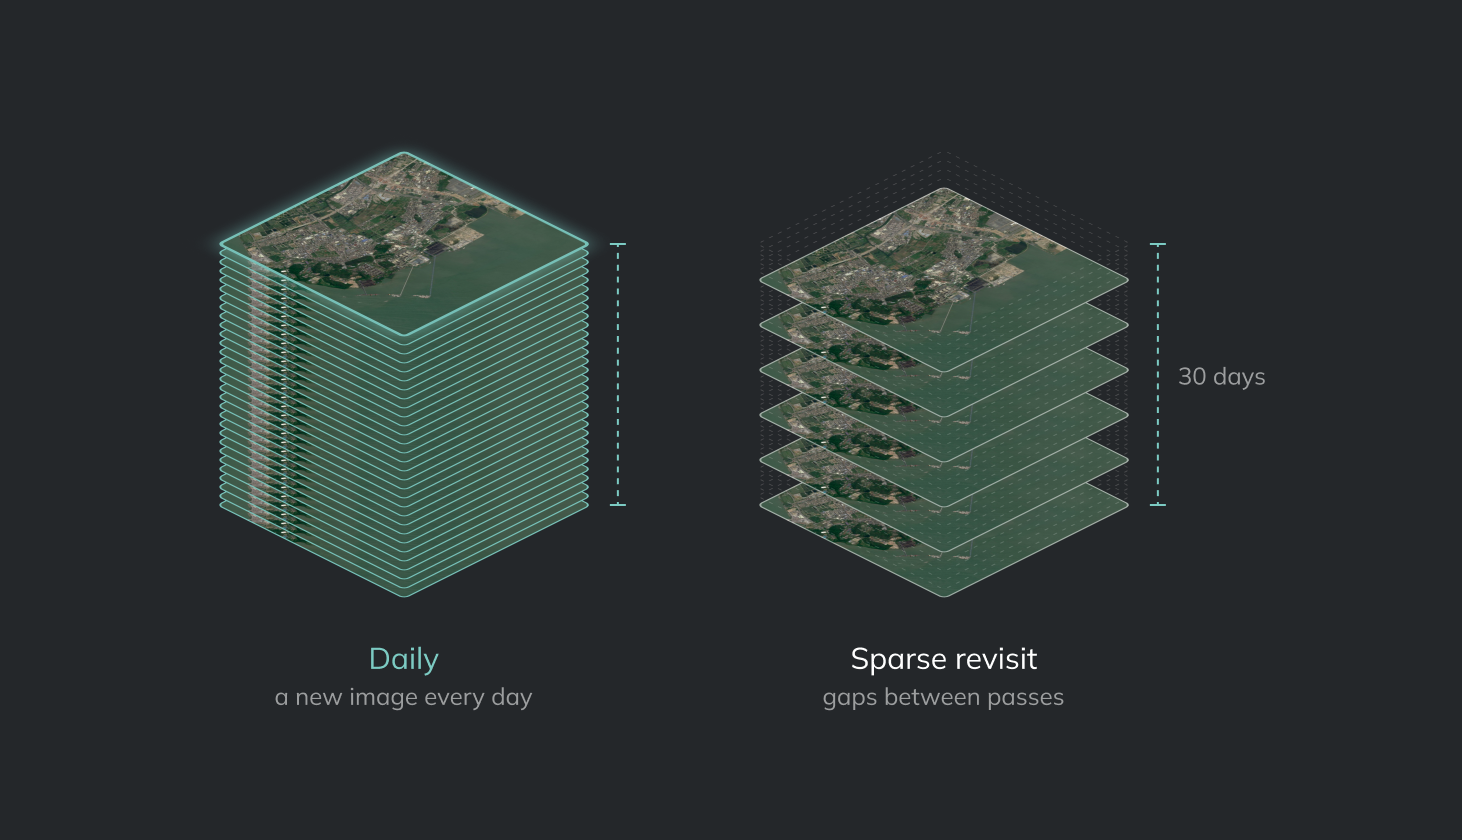
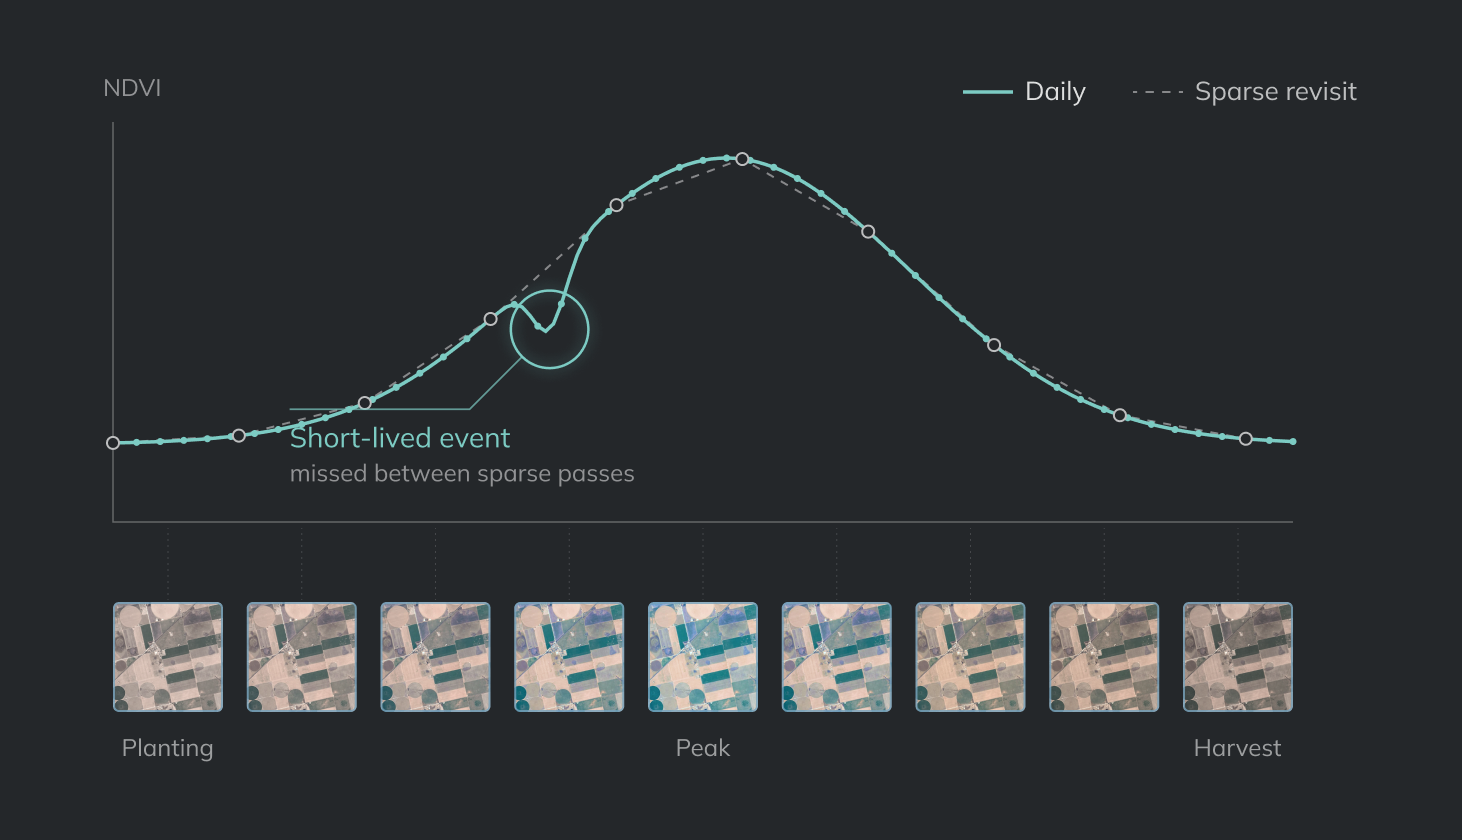
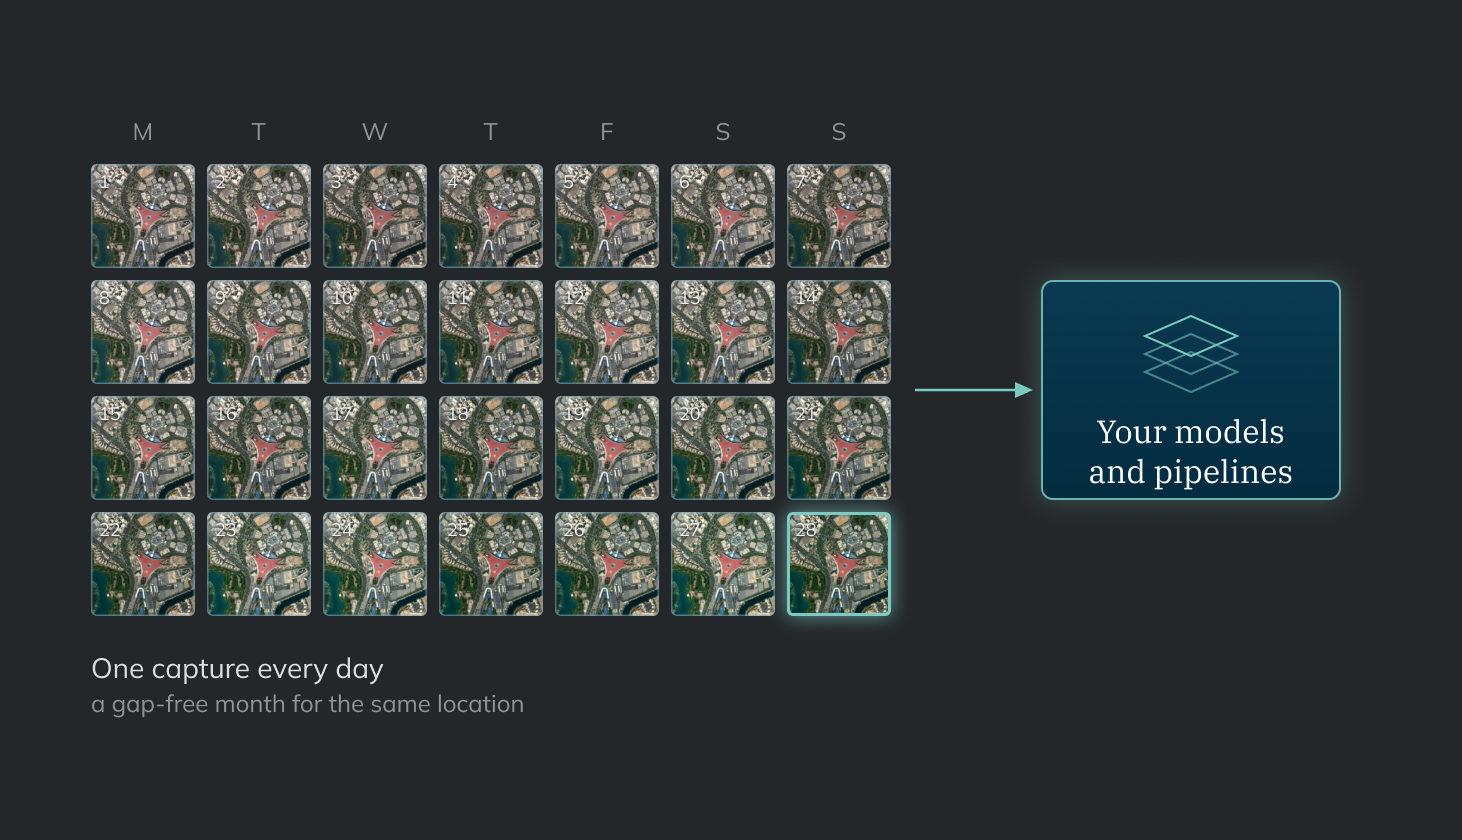
Geolocation, geometry, and radiometry make each image reliable. Capturing those images every day, at the same solar time and viewing angle, turns them into a daily time series.

Two stacks of satellite images over the same port: a daily stack and a sparse stack with gaps between passes

Daily revisit

The constellation images the whole planet every day, so you get each location on a predictable schedule without joining a tasking queue.

  • Daily global coverage: a new image of each location every day
  • No tasking: each observation is already scheduled
  • About 30 images a month of each location

Daily frequency puts the other three properties to use across a full time series.

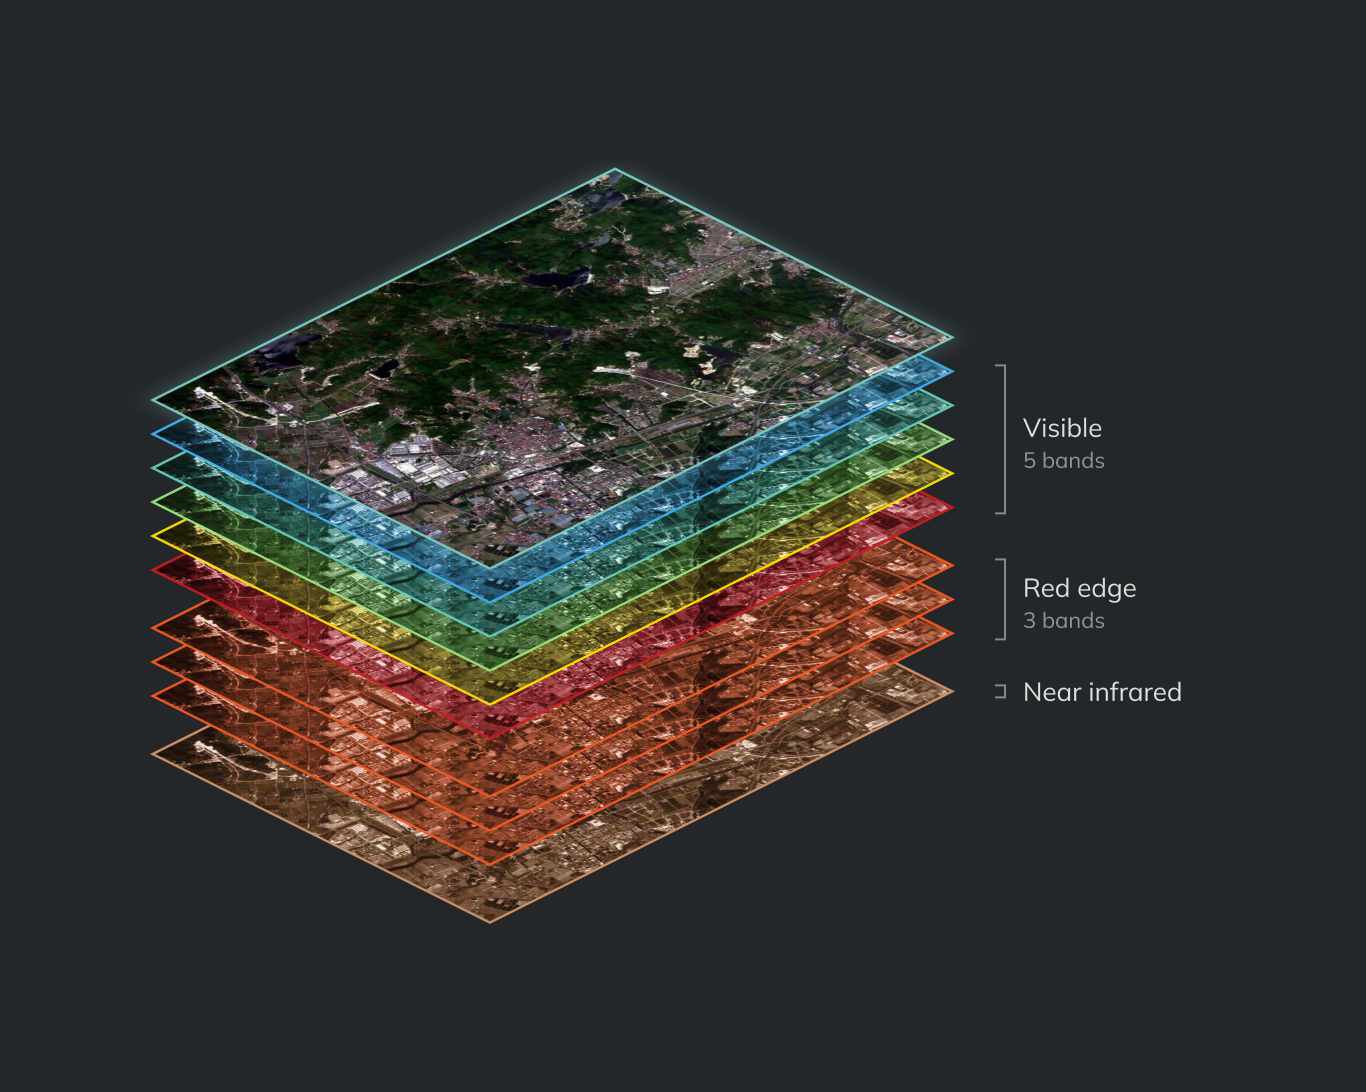
AI-Ready Data: nine calibrated bands stacked as isometric layers, grouped visible, red edge and near infrared

Data use case

AI-Ready Data (AiRD)

Daily cross-calibrated imagery across visible, near-infrared, and shortwave-infrared bands, delivered harmonised, atmospherically corrected, and on a consistent grid, ready to go straight into your models.

Agriculture, mining, energy, infrastructure, and finance teams work from the same consistent baseline, with the preprocessing already done.

Data use case

Rapid Imagery

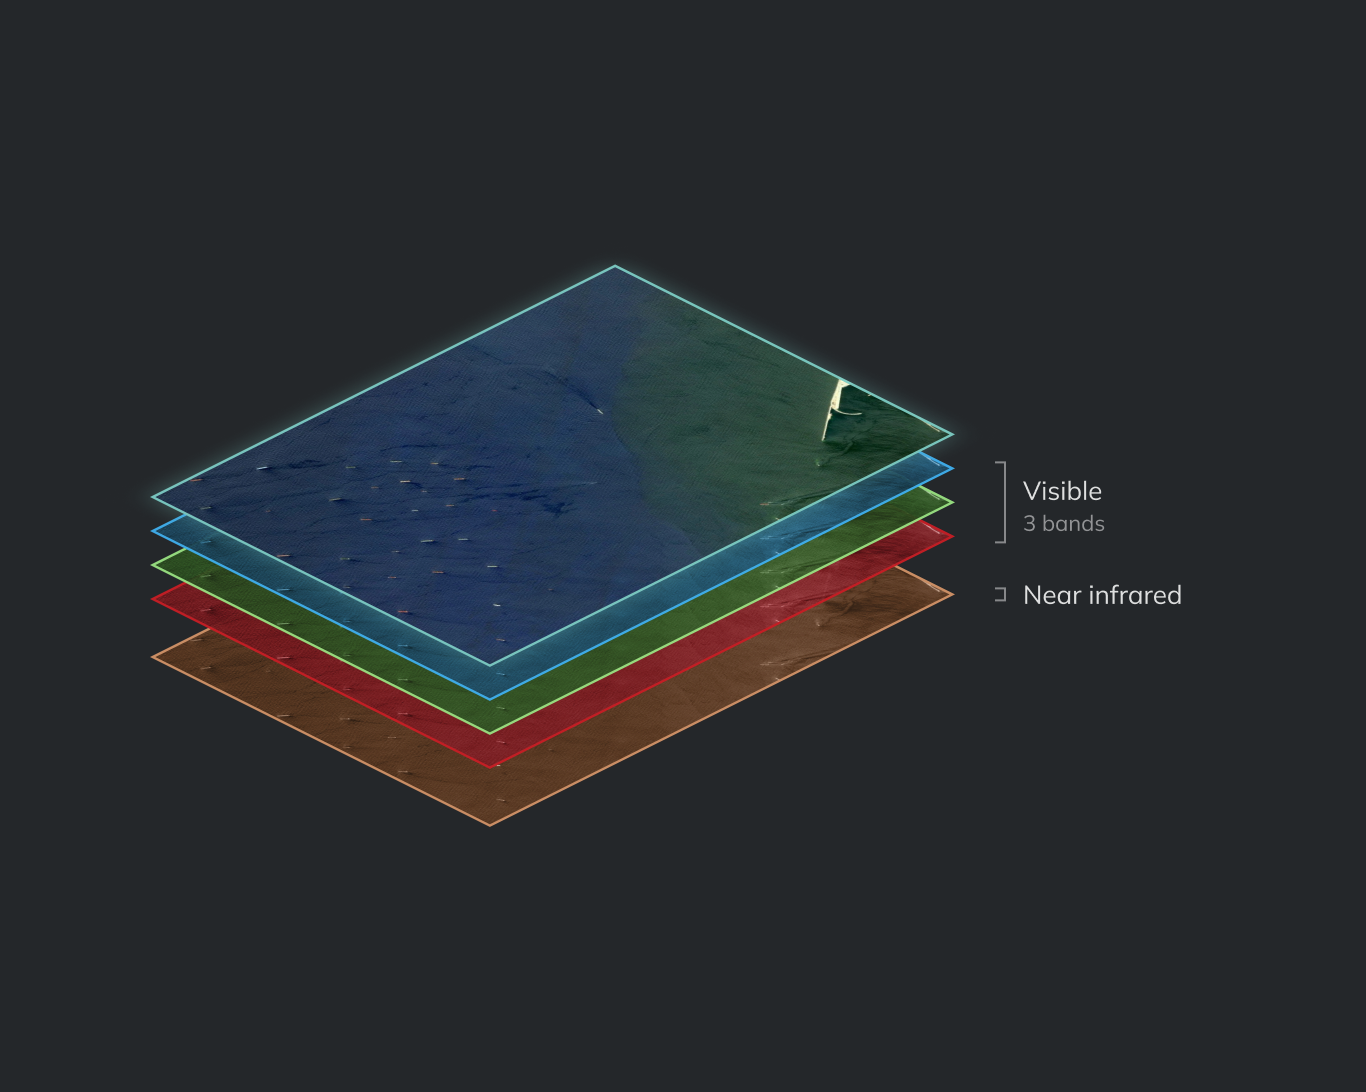
Daily revisit at a consistent solar time and viewing angle supports vessel detection, change attribution, and pattern-of-life analysis across ports, coastlines, and open ocean.

Continuous coverage replaces occasional snapshots with one operational picture for maritime domain awareness, security, and enforcement across your areas of interest.

Rapid Imagery: four calibrated bands stacked as isometric layers, visible and near infrared
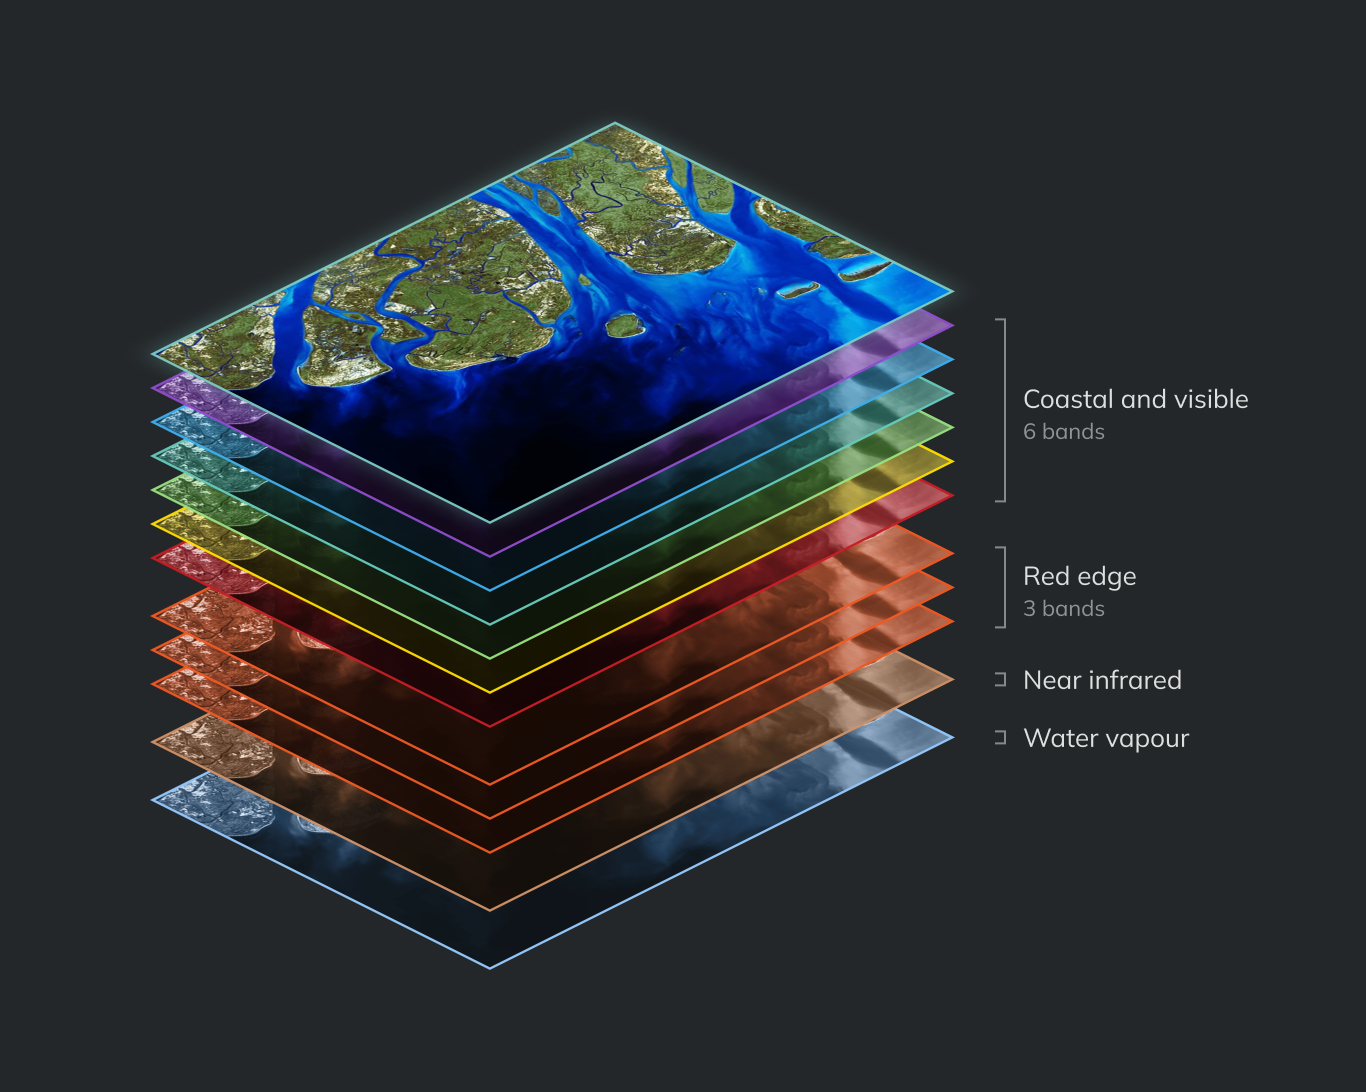
Primary: eleven calibrated bands stacked as isometric layers, from coastal and visible to water vapour

Data use case

Primary

Cross-calibrated imagery in 11 bands, analysis-ready from acquisition and designed to extend the Landsat and Sentinel record to a daily cadence.

Monitor ecosystems, track deforestation and coastal change, and support climate research. Because each capture uses the same solar time and viewing angle, differences in your data come from the ground.

Evaluate EarthDaily data

Book a time with one of our experts to discuss integration.

What you get

  • Reliable change detection

    Changes you detect are changes on the ground.

  • Reliable cloud masks

    Multi-band calibrated cloud masking.

  • Environmental analytics

    Flood, water, vegetation, and anomaly detection.

  • AI-ready time series

    Consistent data for model training and monitoring.

  • Interoperability

    Direct comparison with Sentinel-2 and Landsat data.
Evaluate EarthDaily data

Book a time with one of our experts to discuss integration.