.jpg?width=289&height=168&name=Data%20Use%20cases%20(1).jpg)
Earlier this year, EarthDaily partnered with Bloomberg Intelligence for a mid-season look at U.S. corn and soybean conditions. The conversation focused not only on what we were seeing in the fields at that time, but also on how EarthDaily’s approach to data and analysis helps market participants interpret rapidly evolving crop conditions with clarity and confidence.
This post revisits the core capabilities we shared during that session and summarizes what the data was telling us then, based entirely on the indicators, charts, and analysis presented during the July webinar.
It also sets the stage for the next phase of the conversation, as we prepare for the December 11 session.
REGISTER HERE: US Farm Outlook - Harvest & Fertilizer to Shape 2026 Plans: BI Webinar
A Data Foundation Purpose-Built for Crop Intelligence
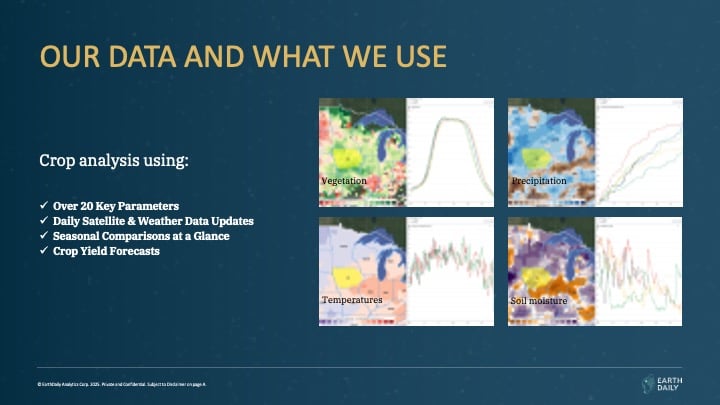
During the July 24 webinar, Felippe Reis, Crop analyst at EarthDaily, walked through the pillars of EarthDaily’s crop monitoring system: more than 20 agronomic and climate indicators, updated daily, and delivered in a format that allows rapid comparison across years, regions, and production cycles. These included:
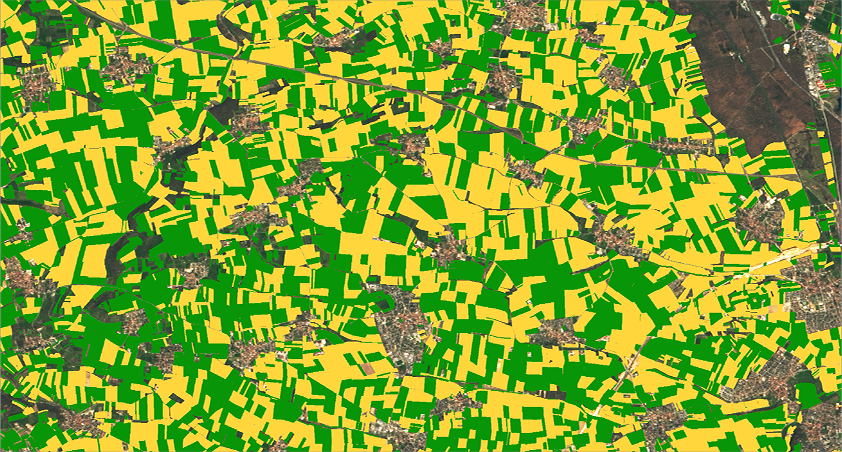
- Vegetation indices, especially NDVI, used to quantify crop vigor and correlate with yield
- Precipitation
- Temperature patterns
- Soil moisture
- Solar radiation
- Historical analogs for trend and deviation analysis
All of these were used to answer the same two foundational questions that guide every crop assessment: where to look and when to look.
Knowing where matters because production is highly concentrated. In Brazil, for example, soybean analysis must focus on Mato Grosso rather than São Paulo. In the United States, Iowa remains a bellwether for both corn and soybeans. Knowing when matters because satellite signals become most meaningful during blooming and grain filling, when NDVI plateaus and yield potential becomes clearer.
This structured approach is what enables EarthDaily to detect emerging issues, and emerging strengths, earlier than traditional reporting cycles.
What the Data Showed Then: Strong Conditions in Key U.S. Regions
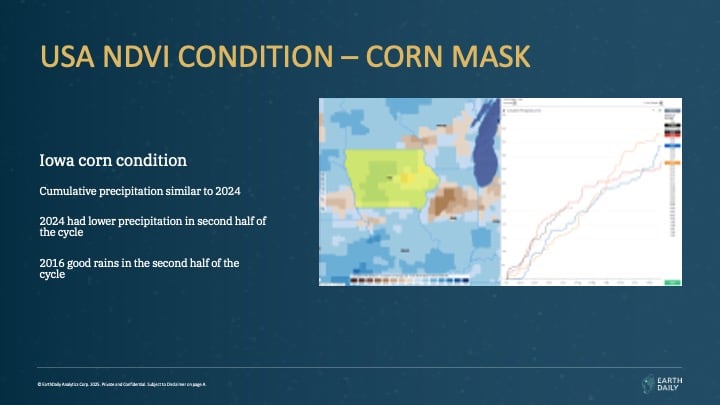
When we turned to the 2025 U.S. outlook until July, the analysis began with Iowa. Both the map-based view and the seasonal curve showed NDVI values comfortably above average for corn, with a smooth progression through the cycle. The temporary dip we showed during the webinar was assessed as cloud contamination rather than a genuine deterioration, supported by the region’s above-normal rainfall in recent weeks.
Analog-year comparison pointed strongly to 2016 and 2021, seasons with similar vegetative trajectories. With supportive weather and no structural stress signal at the time, our Iowa yield estimate stood at 215 bushels per acre, with room for cautious upward bias. This regional assessment fed into a higher-than-USDA national corn estimate, reflecting the strength visible across major producing counties. Soybeans told a similar story.
The Iowa soybean NDVI curve up until July was performing better than the analog years, again most similar to 2016 and 2021. Here too, the late-July dip was linked to cloud interference. Our conservative estimate in the webinar placed Iowa soybeans at 64 bushels per acre at that stage, acknowledging upside potential as data quality normalized. Across both crops, maps showed scattered red zones – areas with lower-than-average NDVI – but these required region-specific follow-up rather than indicating national-level concern.
This is where daily refresh and high spatial granularity matter most: localized anomalies are quickly verified, ruled out, or flagged for deeper analysis.
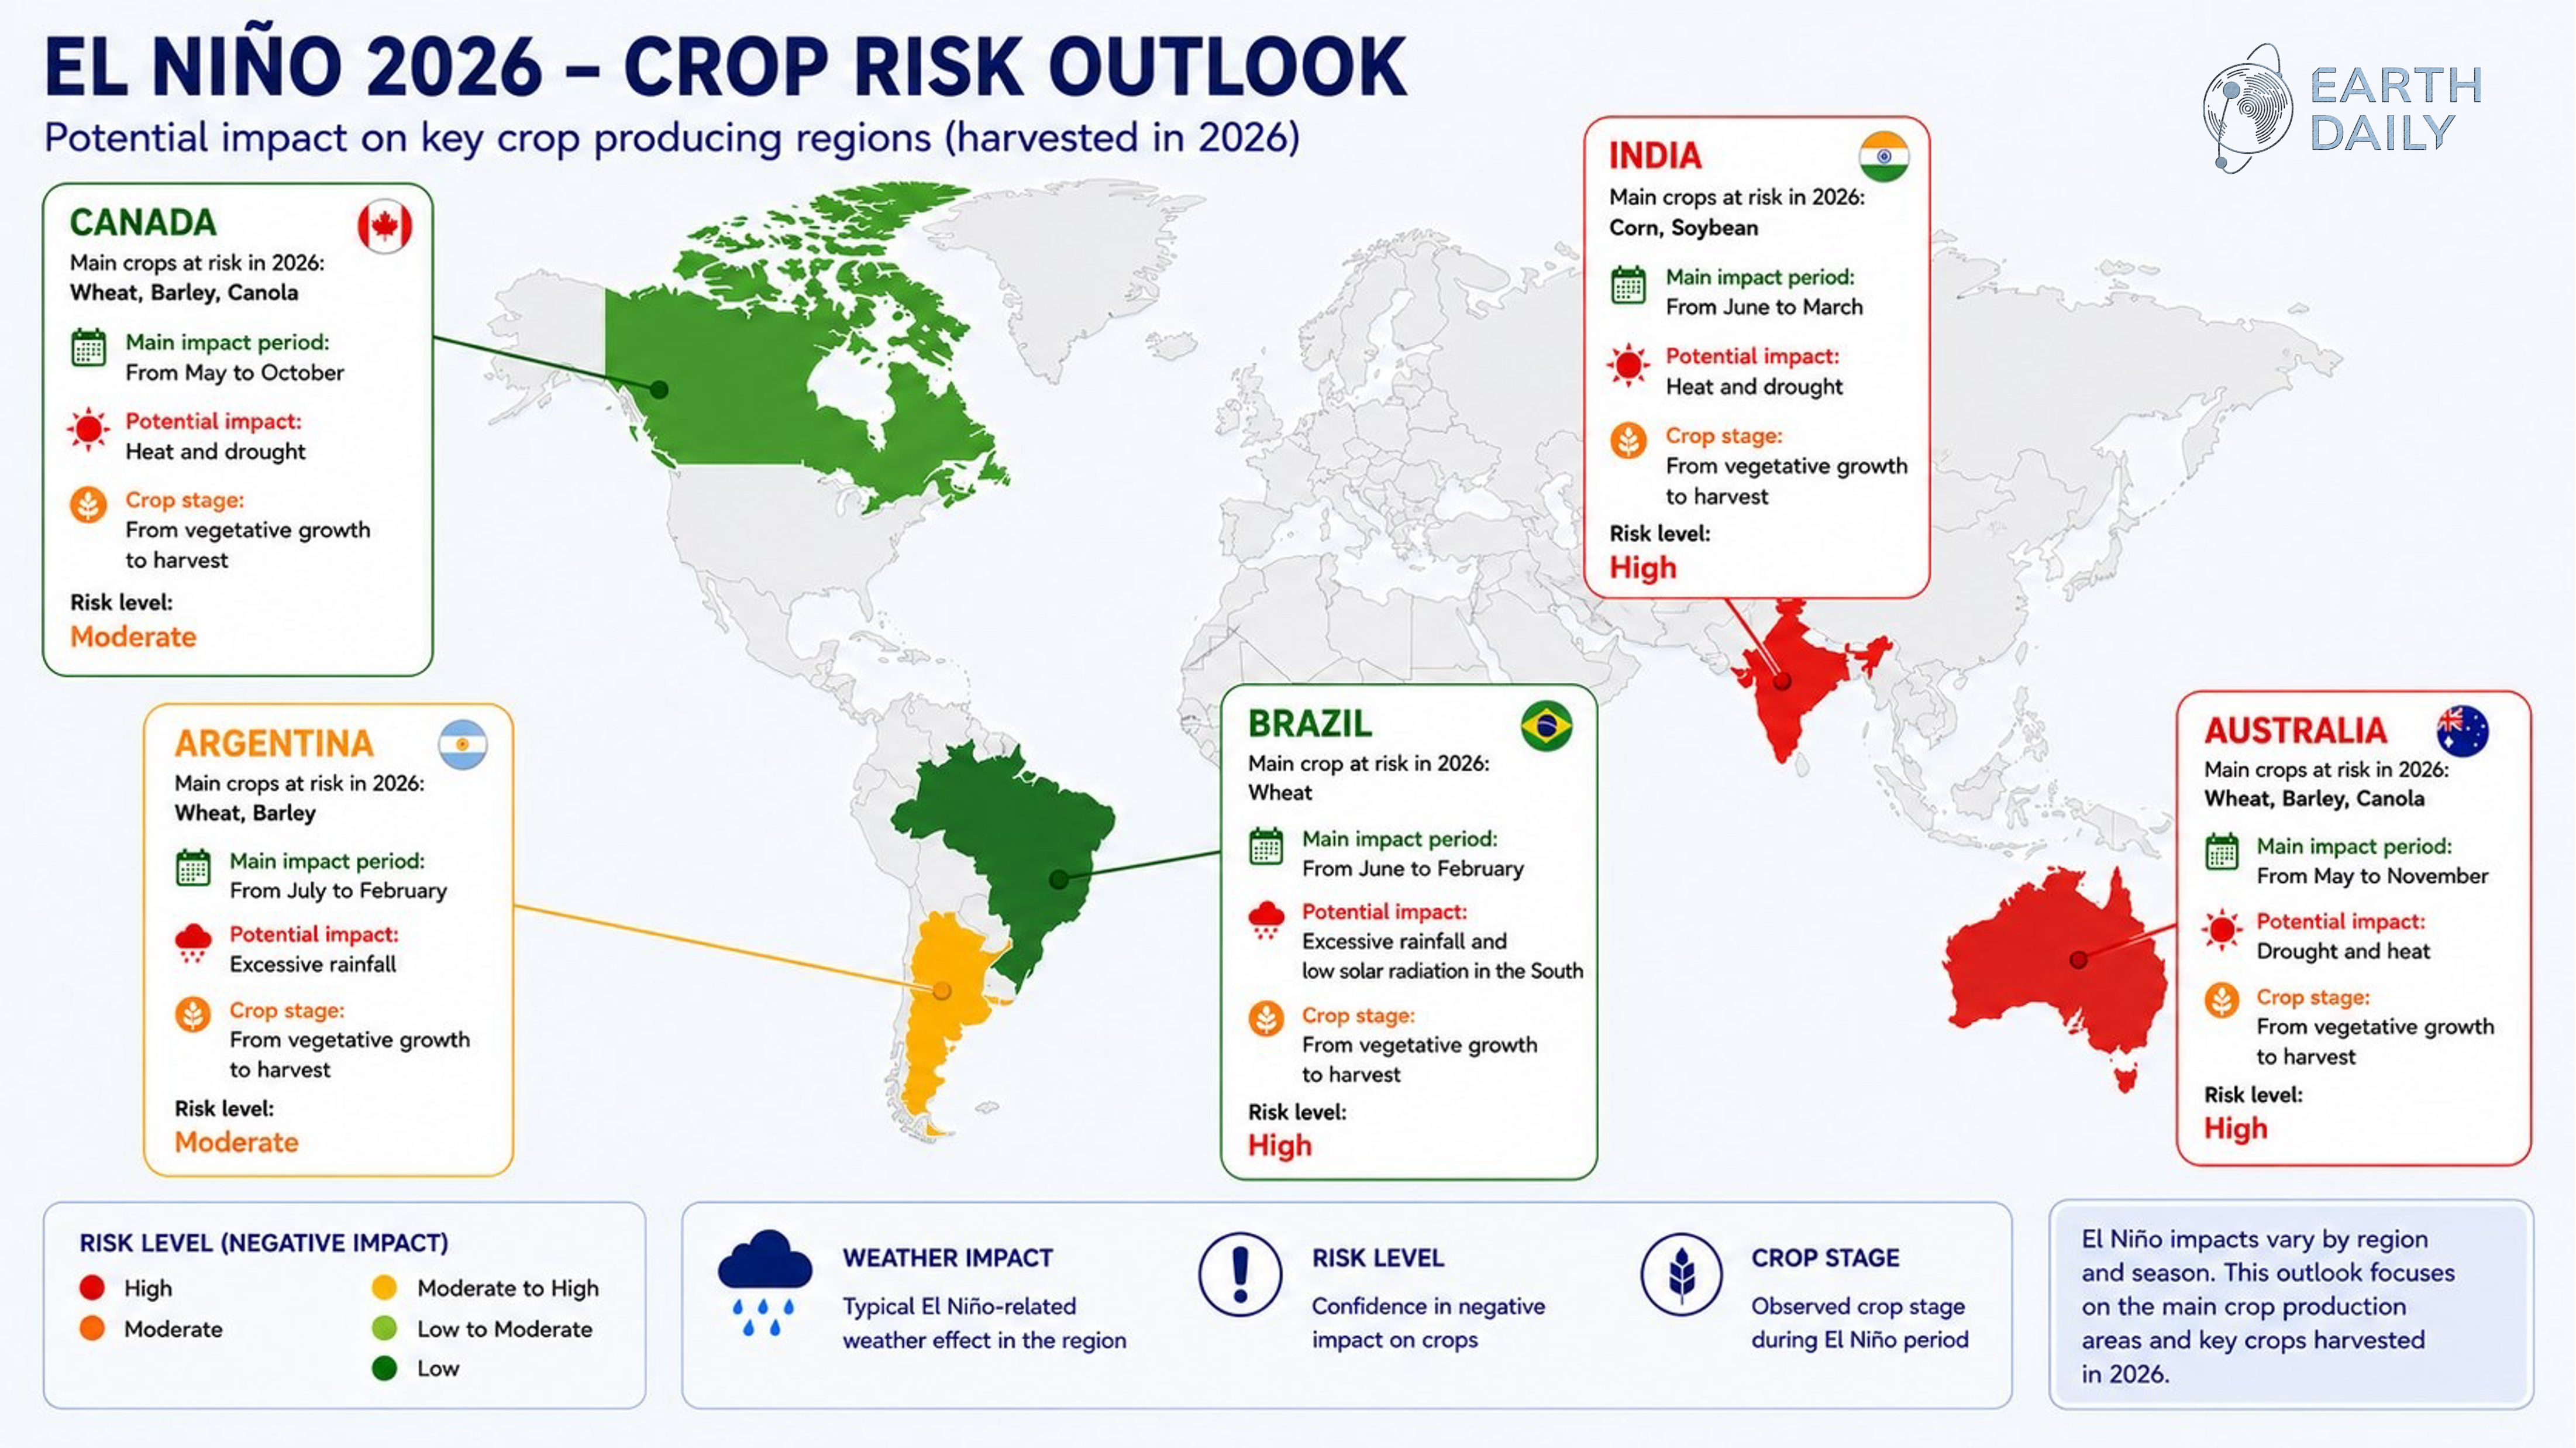
Global Context: Contrasting Signals from China
The July session also carried a short global segment focused on China’s corn cycle. A heat wave in mid-June pushed temperatures in Shandong toward 40°C, contributing to low NDVI values and visible crop stress.
But the national picture was more balanced. Northeastern China, a dominant production region, exhibited strong, stable NDVI, offsetting Shandong’s weakness and supporting an overall optimistic yield bias at that stage of the season. Based on what we presented, the webinar placed China’s potential production around 300 million metric tons, acknowledging that the country would still remain a net importer even at record levels.
The purpose of this comparison was straightforward: to show how daily indicators help distinguish temporary regional stress from national-scale risk, a critical distinction for global balance sheets.
What this Analysis Demonstrated
The July webinar was ultimately an illustration of how continuous satellite-driven monitoring can change the way market participants interpret seasonal conditions. Three themes stood out clearly:
-
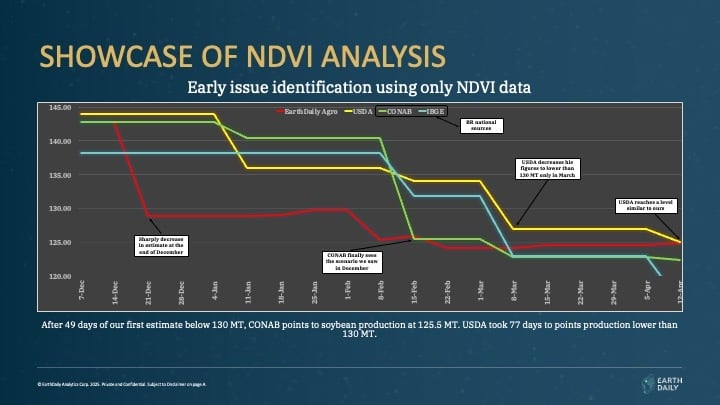
Early detection is possible when data refreshes daily: In Brazil’s 2022 soybean season (a case highlighted during the talk), NDVI signaled trouble in December, long before CONAB and USDA made their major revisions.
-
Yield forecasting improves when multiple indicators align: NDVI, precipitation, and historical analogs together enabled confident mid-season readouts for Iowa corn and soybeans.
- Regional nuance matters: As shown in China, localized stress does not necessarily imply national decline; similarly, pockets of red in the U.S., NDVI maps signal where to investigate, not where to assume losses.
Each of these capabilities is central to EarthDaily’s mission: transforming Earth observation into operational crop intelligence that is usable in real time.
Why This Matters Now
The July session was a snapshot in time, but it showcased methods, not just conditions.
That same methodology is what we bring into every season: high-frequency indicators, rigorous comparison against historical patterns, and analytical workflows built for early signal detection.
As we approach the December 11 webinar, the conversation picks up from here. The focus shifts to how the season ultimately evolved, what the indicators captured across the second half of the cycle, and how global crop signals have shifted since the mid-year view.