

What Makes Earth Observation Data Trustworthy? Seven Questions to Ask
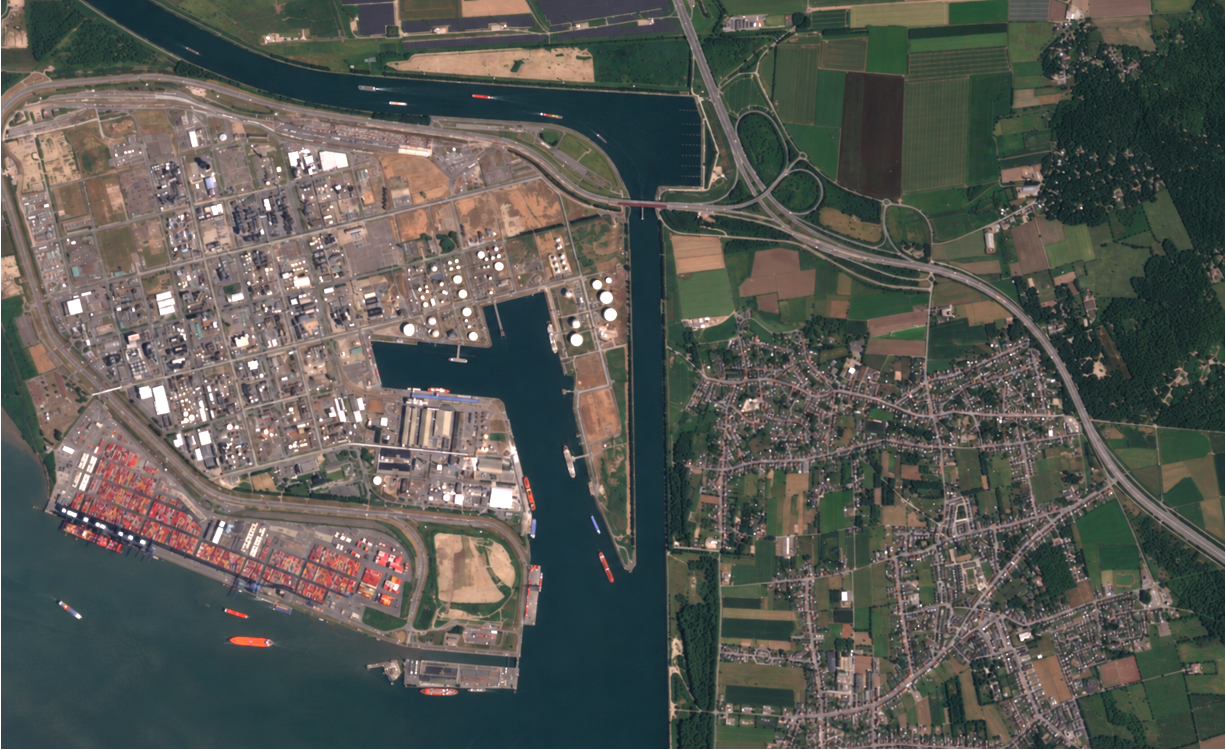
Port of Antwerp, Belgium, imaged by the EarthDaily Constellation in June 2026.
Most Earth observation evaluations start with a spec sheet: resolution, revisit, coverage, latency, price. The comparison is worth making. It shows what a system can see and how often. It can’t show whether the measurements will stay accurate and comparable as satellites and years change.
More organizations are starting to ask that second question directly. Can the data support the conclusion it will be used to draw?
A joint quality assessment framework from NASA, the European Space Agency and the USGS, signed in April 2026, gives the question some shape. It’s voluntary and non-binding, and what it offers is a way to look at the evidence behind a data-quality claim. Its questions adapt well into a checklist for anyone evaluating data quality. The framework works in two stages, documentation review and detailed validation, which suggests a simple test: an answer holds up when the process is documented and the delivered data are shown to meet stated performance.
These questions apply to any commercial optical EO provider, EarthDaily included. This guide doesn’t evaluate or endorse any single company’s data. It adapts public-sector guidance into questions that can be put to any provider.
Scope
This guide focuses on one part of provider evaluation: the quality of commercial optical Earth observation data. Price, licensing, availability, delivery formats, integrations and support also shape a decision and sit outside this guide’s scope. SAR, elevation, atmospheric and other measurement domains need different assessment criteria.
Start with the decision
Before comparing anything, pin down the job:
-
What physical change or condition must be detected or measured?
-
How large and how fast is the expected change?
-
Is the requirement a single observation or a time series?
-
Will people, algorithms or both interpret the data?
-
How much uncertainty can the decision tolerate?
-
Which spectral bands, quality conditions and geographic environments matter most?
What the familiar specifications establish
|
Specification |
What it establishes |
What it leaves open |
|
Spatial resolution |
The nominal ground sampling of the product, or the scale of detail it can resolve |
Positional accuracy, radiometric quality, or whether neighboring observations line up |
|
Revisit |
How often a satellite or constellation may be able to observe a location |
Whether a usable observation arrives, or whether measurements from different satellites are comparable |
|
Coverage |
The area the system can collect |
Whether quality holds across that area and under different surface and atmospheric conditions |
|
Latency |
How quickly data arrive after collection |
Whether the delivered product is calibrated, corrected and quality-screened enough for the use |
|
Temporal consistency |
That observations exist across time |
Whether measurements stay consistent across sensors, processing versions and calibration updates |
Seven questions to ask next
A spec sheet shows whether a product deserves a closer look. The seven questions below help judge whether its measurements can be trusted.
Question 1: How accurately is each observation located?
Picture a sharp image of a field whose boundary sits slightly off its true position. Pixels near the edge now describe the wrong surface, and any measurement or change analysis built on them carries the error. Resolution and positional accuracy are related, yet they’re separate things.
Ask for:
-
Absolute positional accuracy, with a stated confidence level
-
The ground references and geographic areas used to validate it
-
Band-to-band registration results when bands get combined
-
Evidence that geometric performance is checked again as the mission ages
Area estimation, field-level agriculture, infrastructure monitoring, shoreline work and anything that compares pixels across dates feels this first. Pixel size sets the sampling scale; placement has to be shown separately.
Question 2: Can observations from different dates and satellites be compared?
A record built from many satellites can contain differences that don’t come from the ground. Sensor response, atmosphere, viewing geometry, cloud, shadow and spatial alignment all change what a pixel reports, and collecting more often doesn’t remove those differences.
Look for:
-
A documented cross-sensor calibration and harmonization approach
-
Methods for atmospheric correction, cloud and shadow screening, geometric alignment and viewing-angle effects
-
Results that show how much difference remains between satellites after processing
-
A plain statement of when comparability drops or users need to add their own processing
Crop monitoring, burn-severity assessment, forest change, broad-area monitoring and any time-series or threshold-based analysis depend on it. Revisit offers another opportunity to observe. Whether that observation sits on the same measurement scale is something the evidence has to settle.
Question 3: Is every sensor in the constellation evaluated individually?
Constellations tend to arrive as one product, yet every measurement still comes from a particular instrument. Sensors built to the same design can differ through manufacturing, integration, launch, operating conditions and aging. The framework asks that constellation products identify the source satellite, so it’s possible to ask whether performance has been examined sensor by sensor.
A thorough answer covers:
-
Results for individual sensors in addition to a constellation average
-
How performance varies between satellites, by spectral band and over time
-
How anomalous sensor behavior is detected, investigated and corrected
-
What happens to satellites or observations that fall outside expected performance
Anything that treats a constellation’s observations as interchangeable depends on this answer, whether that’s automated change detection, a large operational archive or a training set for an AI model. A fleet can hit its average target while one satellite sits well away from the rest, and the average can hide it.
Question 4: Is performance characterized separately by spectral band?
Two instruments can both list a near-infrared band and still measure slightly different wavelengths. Red, NIR and SWIR are labels for wide stretches of the spectrum, and each sensor’s band covers only part of its stretch, with edges of its own. A vegetation index is calculated from a ratio or difference between bands, so a small shift in either band carries through to the result.
Useful evidence includes:
-
The spectral response function for each band
-
Radiometric validation and uncertainty reported band by band
-
Band-to-band registration results
-
Any bandpass adjustment or harmonization applied when sensors were combined
Vegetation indices, burn-severity products, moisture analysis, mineral mapping and water-quality work rely on specific bands and feel a weak one first. An overall quality figure can look fine while the one band carrying the signal is the weak one.
Question 5: What references and methods support the calibration?
“Calibrated” is a common claim, and it names a process without showing the strength of the evidence behind it. It helps to see how the sensor’s digital output is tied to a physical measurement and how that tie is kept after launch:
-
Pre-launch characterization methods and traceability to recognized standards
-
On-orbit methods such as onboard systems, stable Earth targets, lunar observations or independent ground networks such as RadCalNet, whose reference data cover the visible and near-infrared, from 400 to 1000 nanometers
-
Independent validation results, along with the uncertainty of the reference measurements
-
A plan for monitoring drift and updating calibration over the life of the mission
Quantitative reflectance or temperature products, long-term monitoring, multi-sensor records and any decision where small measurement changes matter all rely on it. The useful follow-up to “Is it calibrated?” is “Against what, with what uncertainty, and how is it maintained?”
Question 6: What does the reported uncertainty reveal beyond the average?
A single accuracy figure or average can hide a great deal. It can’t describe every satellite, band, surface type and acquisition condition. Reported uncertainty describes the doubt around a measurement, while the distribution of validation results shows how performance varied and whether outliers could affect the intended analysis.
Worth asking about:
-
A stated uncertainty and a clear method for how it was calculated
-
Results across the bands, signal levels, surfaces, geographies and time periods that matter
-
The distribution of performance, including outliers, rather than only the mean
-
The conditions under which uncertainty grows
Alerts that fire on a threshold, slow-change monitoring, AI models and long time series feel this most, and so does any application hunting a signal about as big as the measurement uncertainty. An average describes how a typical observation behaves. The risk usually sits in the observations that stray from it.
Question 7: Does quality information follow the data into analytics and AI?
An algorithm works with whatever number it’s handed. It can’t reliably determine on its own whether a difference came from the surface, the atmosphere, the sensor, the viewing geometry or the processing. Provenance and quality information fill that gap, and a result that has to be defended needs both.
The answer should cover:
-
Metadata identifying the source satellite, instrument, acquisition geometry and processing version
-
Quality flags for cloud, shadow, saturation, aerosols and other relevant conditions
-
Documented product updates, with notice of changes that could affect models or thresholds
-
A reprocessing policy that explains how archive consistency is kept when calibration or algorithms improve
Model development, automated alerts, operational change detection and regulatory evidence all depend on it, as does any workflow that has to be reproduced or audited later. When data is called AI-ready, the measurement’s integrity and traceability should come with it, along with easy access.
How priorities change by application
Every quality dimension matters somewhere, but how much a weakness costs depends on the use. These are starting points, and application-specific testing is still needed.
-
Agriculture and forestry: both depend on telling slow, gradual change from noise, so stability across seasons and years, consistent red and NIR bands, sound atmospheric correction and a continuous archive count most. Accurate geolocation and careful cloud and shadow handling matter for field-level work.
-
Wildfire and public safety: rapid-response uses put delivery latency and geolocation first, followed by NIR and SWIR performance, how cloud and smoke are treated and dependable pre-fire baselines. Burn-severity and recovery work leans harder on spectral performance and baseline consistency.
-
Environmental, coastal and maritime monitoring: shoreline alignment, sunglint and atmospheric effects, cloud and haze screening and radiometric stability, with a continuous archive for seasonal comparison.
-
Mining, energy and infrastructure: spectral characterization and signal-to-noise for identifying materials, plus positional accuracy, band registration and geometric stability for catching incremental change.
-
Defense, insurance and civil government: results get audited and challenged, so provenance, reproducibility and defensible uncertainty matter, along with cross-sensor consistency, positional accuracy and broad-area coverage.
-
AI model development: stable input distributions, source-sensor metadata, processing versions, quality propagation and reprocessing history.
Priorities shift with the application, but the underlying test stays the same: does documented and validated performance support the intended decision?
The questions above are an unofficial, plain-language adaptation of the framework’s principles. They aren’t a procurement document, a certification or a substitute for application-specific technical evaluation. The primary sources below are the place to go deeper.
The next article looks at the terms this checklist depends on, such as accuracy, calibration, validation and uncertainty, and the different meanings they can carry in practice.
Sources and further reading
Joint Earth Observation Mission Quality Assessment Framework: Optical Guidelines
NASA, ESA and USGS. Voluntary guidance for documentation review and detailed validation of optical EO missions.
CSDA Satellite Data Evaluation
NASA’s overview of its commercial satellite data evaluation process.
Harmonized Landsat Sentinel-2 Algorithms
NASA’s explanation of the corrections used to make Landsat and Sentinel-2 observations comparable for time-series analysis.
Maintaining the Gold Standard: The Future of Landsat Calibration and Validation
NASA overview of continuing calibration, validation and instrument-performance monitoring for Landsat.
RadCalNet
CEOS-coordinated network of instrumented ground sites used for independent radiometric validation.
About the Author