.jpg?width=289&height=168&name=Data%20Use%20cases%20(1).jpg)
In this science-grade data series, we have looked at calibration, consistency, and comparability. But there is another part of the measurement story: spatial quality.
In Earth observation, a number printed on a spec sheet does not always tell the full story. Ground sampling distance, or GSD, describes pixel spacing on the ground. But usable spatial detail depends on more than pixel size. It also depends on optics, signal quality, sensor performance, and whether the image has been artificially sharpened.
GSD is Not the Whole Story
A 5 m pixel does not automatically mean the image delivers true 5 m spatial detail. In some systems, the advertised GSD and the effective spatial resolution can be different. If an image looks sharper because of generative ML-based enhancement rather than true measurement, that may help visual interpretation but can create problems for analysis.
When growth trends, insurance claims, or audits rely on pixels that were partially invented, the outcomes become difficult to trust and defend. Users need to know what the sensor actually measured, not only what the image appears to show. Science needs the measurement, not the rendering
Sentinel-2 provides a trusted science-grade reference at 10 m resolution, with landmass coverage every five days. EarthDaily’s constellation is designed to build on that benchmark with 5 m imagery and daily global landmass coverage. The difference is not only spatial detail, but also how often that detail can be collected consistently.
 Ground sampling distance and true spatial resolution are not always the same. This comparison shows Sentinel-2 as a true 10 m system and EarthDaily as a true 5 m unsharpened system, with the Google Earth zoom confirming feature separation of approximately 2.6 m.
Why Unsharpened Detail Matters
For science-grade data, spatial detail has to come from the measurement system itself. EarthDaily Constellation (EDC) imagery is a true 5 m system, where spatial detail is directly observed by the sensor at 5m, never fabricated through sharpening, super-resolution, or generative modeling.
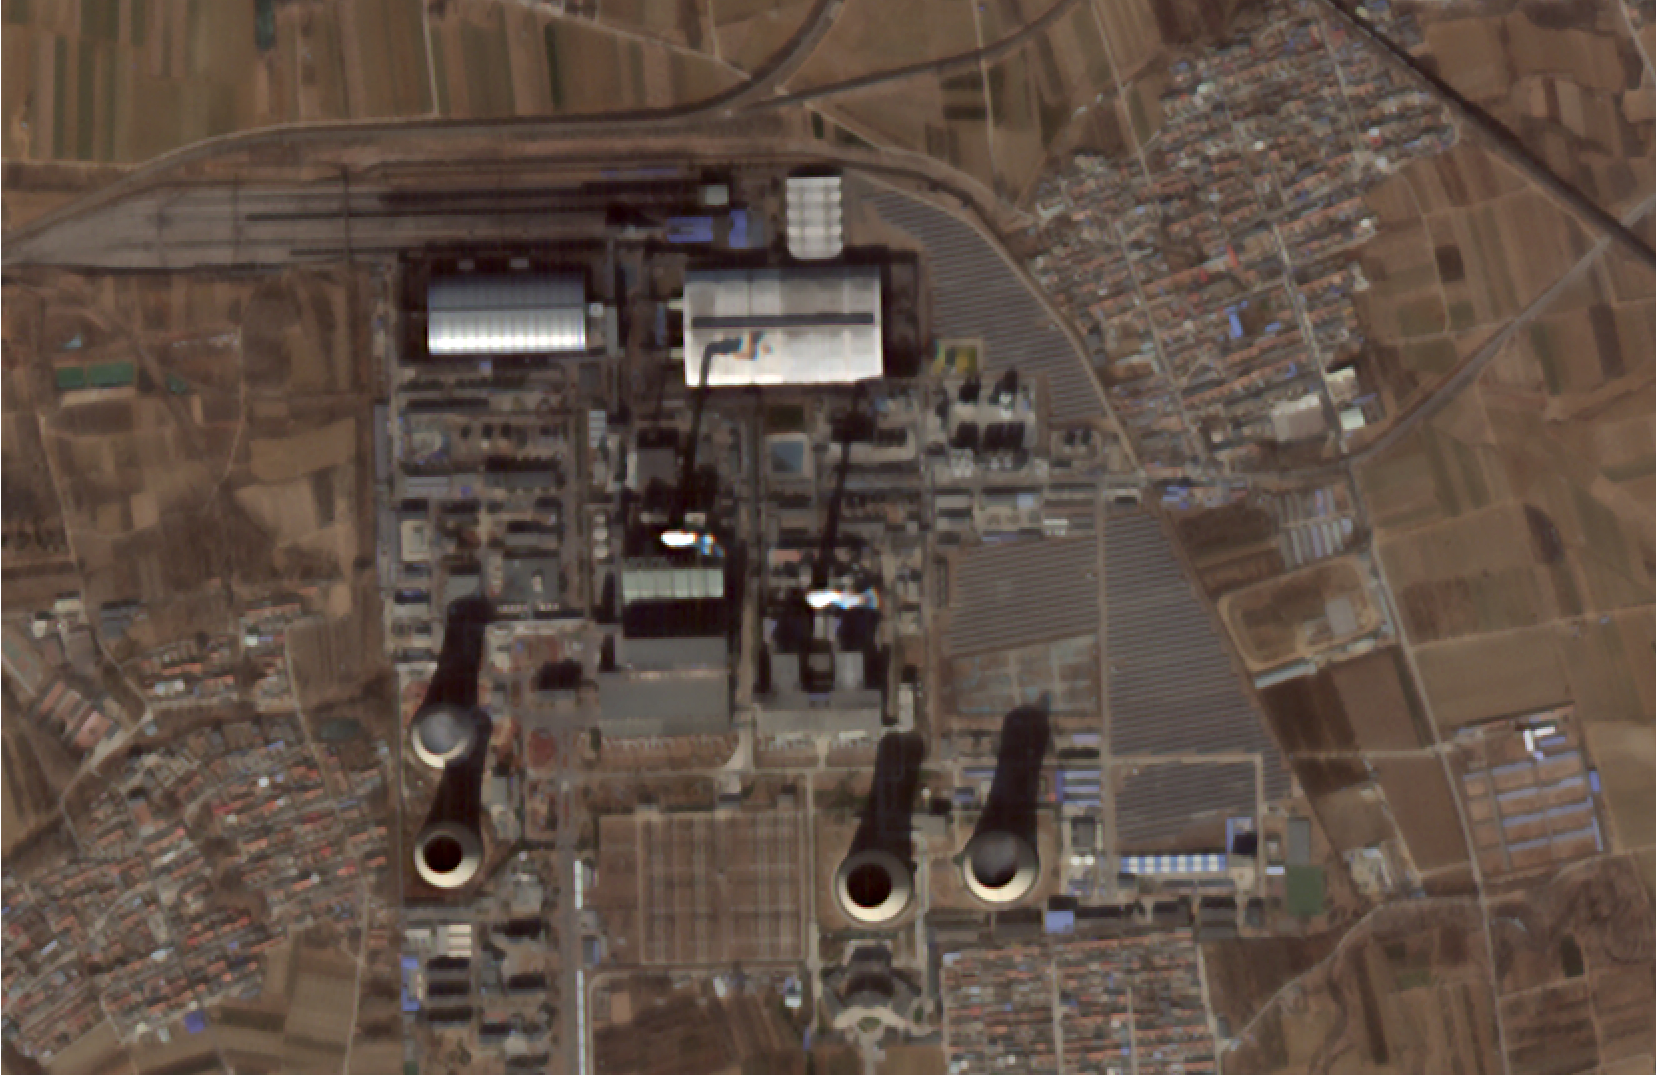
In the sample imagery, fine infrastructure features remain visually distinguishable because of the system’s signal-to-noise ratio and imager quality. This is visible in comparisons with Sentinel-2, where EarthDaily’s 5 m imagery makes roads, buildings, solar-panel rows, and other surface features easier to distinguish.
 Sentinel-2 10 m imagery compared with EarthDaily 5 m imagery over power plant infrastructure and nearby solar-panel arrays. The comparison shows how EarthDaily’s higher spatial resolution, combined with planned daily global landmass coverage, can make buildings, roads, panel rows, and other surface features easier to distinguish.
But visual comparison alone is not enough. To check whether the fine features visible in EDC correspond to real structures on the ground, the team compared the imagery against high-resolution Google Earth reference imagery.
 Google Earth reference imagery of the same electrical substation, showing narrow infrastructure features measured at approximately 2.5 m apart. This reference was used to check fine feature separation visible in EDC 5 m imagery.
Although EDC is a 5 m system, the electrical grid structure visible in the lower centre of the EDC image shows fine feature separation corresponding to features measured at approximately 2.5 m in Google Earth.
This does not make EDC a 2.5 m system. It shows that strong image quality can help preserve fine spatial structure within a true 5 m product.
That same spatial-quality point applies across different kinds of infrastructure and land-cover patterns. Power plant infrastructure, roads, solar-panel rows, plantation patterns, field boundaries, and access roads all depend on clean spatial detail if they are going to be used in analysis.
Science-grade system design helps preserve that detail. Strong signal quality, stable measurement, and unsharpened imagery make it easier to distinguish features that might otherwise be blurred, distorted, or confused with processing artifacts.
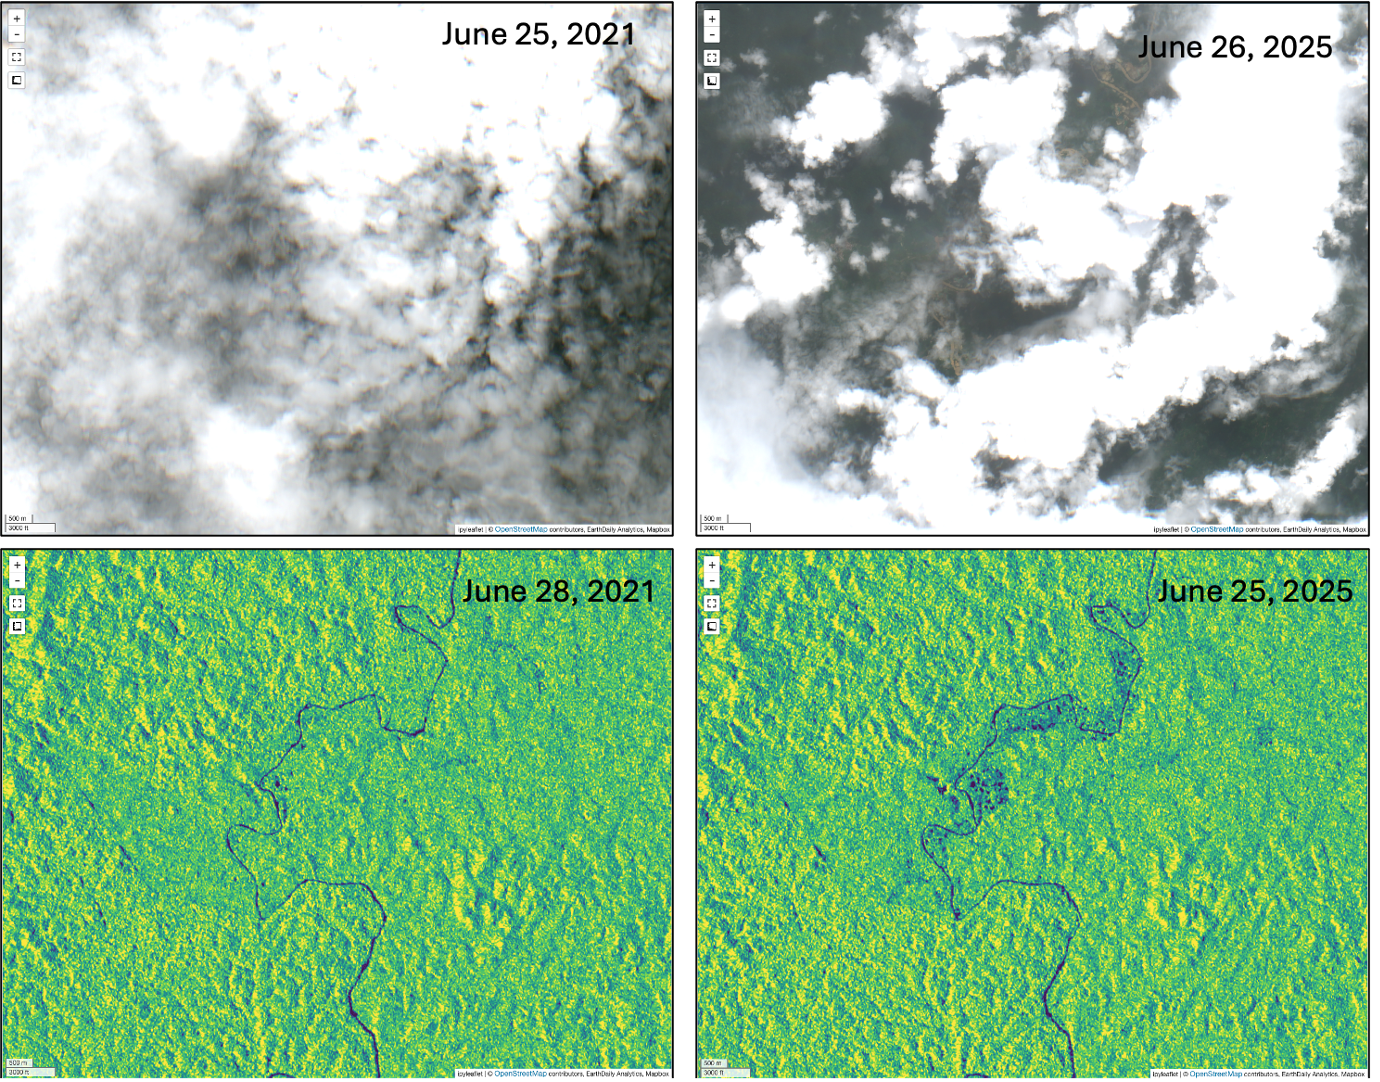
A More Reliable Baseline for Detecting Change
For change detection, spatial quality affects confidence. If field boundaries, roads, infrastructure, crop rows, or narrow features are blurred or artificially sharpened, it becomes harder to tell whether a change is real or introduced by the image product.
A true, unsharpened spatial product gives analysts a clearer baseline. When the same area is observed again, the comparison is more reliable because the detail comes from the measurement system itself.
The same point applies in agricultural and vegetated landscapes, where field boundaries, access roads, crop rows, and plantation patterns may be part of the analysis.
 Reference imagery compared with EDC 5 m imagery, illustrating how true spatial resolution helps preserve plantation rows, field boundaries, access roads, and other surface patterns used in analysis.
Science-grade Earth observation data depends on more than frequent coverage or high visual quality. It requires measurements that are calibrated, consistent, physically meaningful, and spatially reliable. When spatial detail is preserved by the measurement system itself, it becomes more dependable for change detection, monitoring, and the analytical workflows built on top of it.
This is also where EarthDaily’s work is headed next. The EarthDaily Constellation is designed to generate daily, global, science-grade observations across visible, infrared, and thermal bands — the kind of consistent data stream needed to train geospatial foundation models. These models can help turn repeated measurements of the planet into a deeper understanding of current conditions, emerging change, and future risk across applications such as agriculture, wildfire, security, and environmental monitoring.
For geospatial AI, the quality of the input data will shape the reliability of the model output. With consistent, calibrated observations collected every day, EarthDaily is building the data foundation for the next phase of Earth intelligence — moving from observing change to anticipating it.
To see how science-grade measurements are delivered across EarthDaily's data products and analytics offerings, explore the full portfolio.