
.jpg?width=289&height=168&name=Data%20Use%20cases%20(1).jpg)
Why Climate Risk Needs a Continuous Record of Change
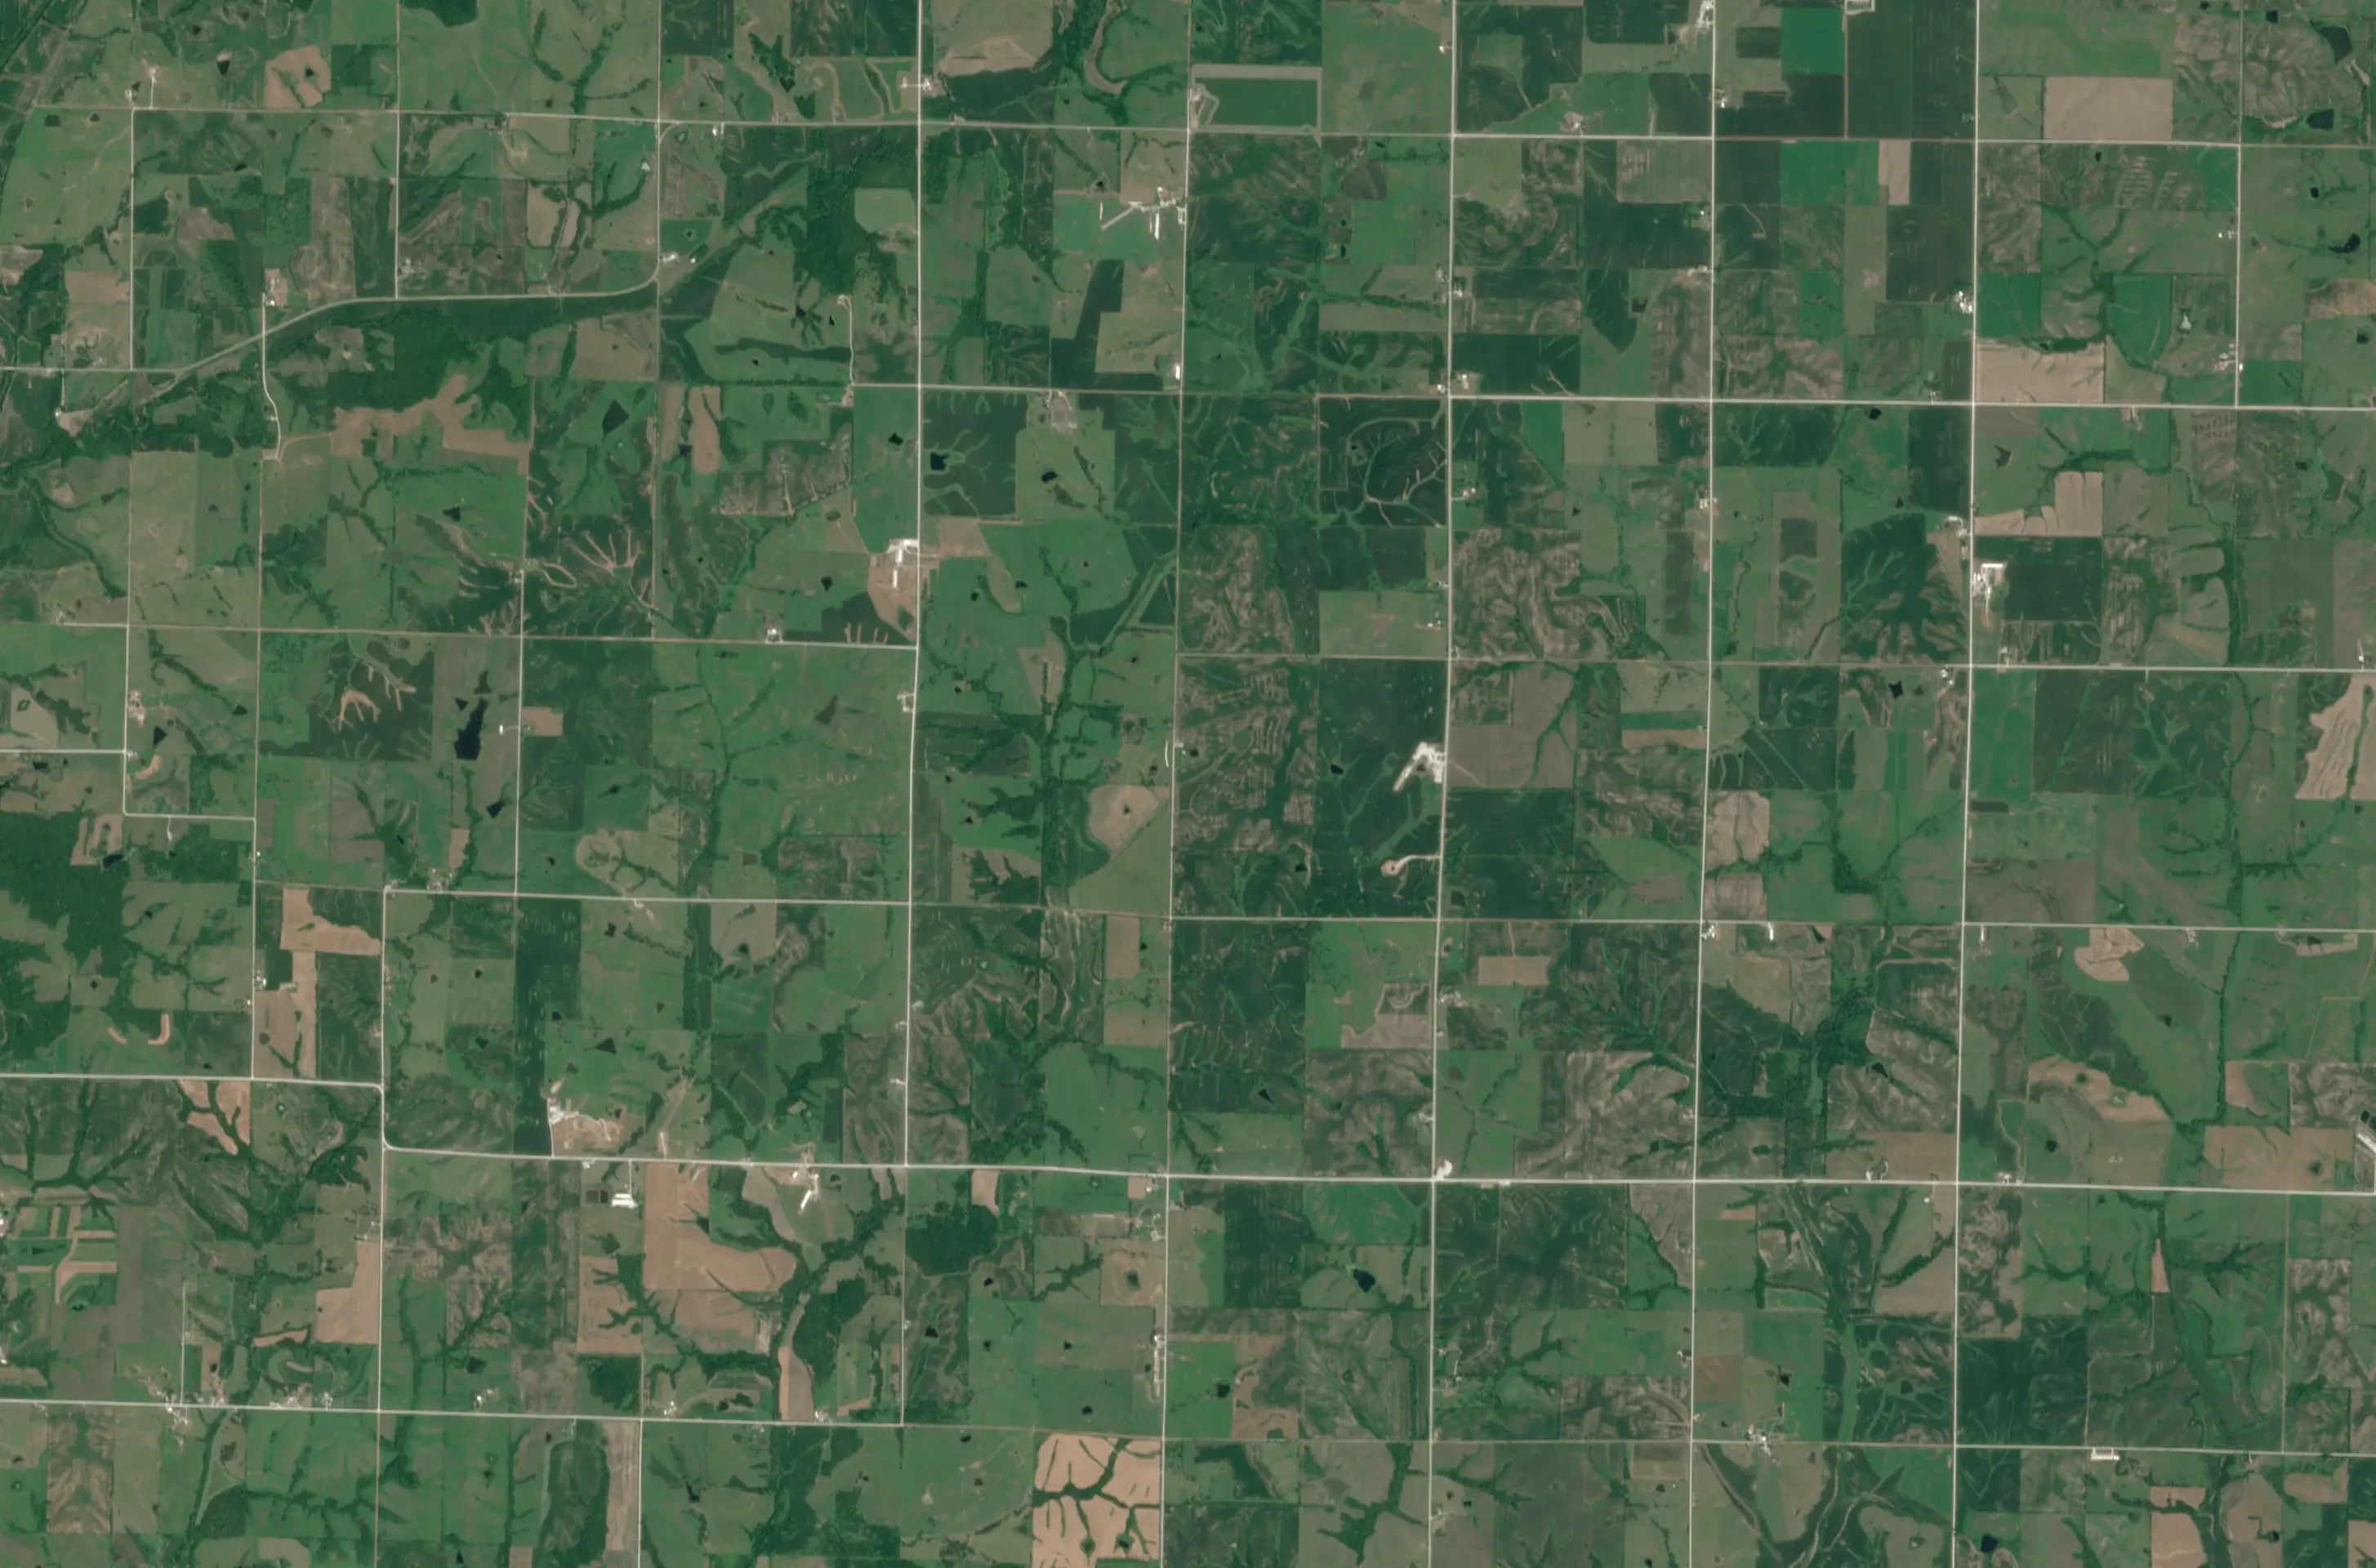
Climate risk builds before a fire ignites or a crop fails. Continuous Earth observation helps track the signals shaping response and recovery.
The records keep breaking. August 2026 was the hottest August since records began, WMO said last week. Global temperature came in 1.65°C above the pre-industrial baseline. Daily sea-surface temperatures outside the polar regions set a record as well.
August was part of a longer run. WMO says 2015 to 2025 were the 11 warmest years in the 176-year observational record.
Those figures describe the climate at a global scale. On the ground, the effects arrive unevenly.
Everything has a pulse. Forests, fields and watersheds show the strain first. The question is whether we can recognize it while there is still time to act.
That is the question behind Earth Observation for Climate: 2026 Edition, hosted by TerraWatch Space during NYC Climate Week on September 24. EarthDaily is sponsoring the conversation, which will bring wildfire, agriculture, insurance and risk modeling experts into the same room.
Signals gather before an event
A wildfire gets a name when it ignites. Its risk was taking shape earlier, as heat dried vegetation and soil moisture fell. The days after the fire matter too, as burned ground either starts to recover or becomes vulnerable to a different set of risks.
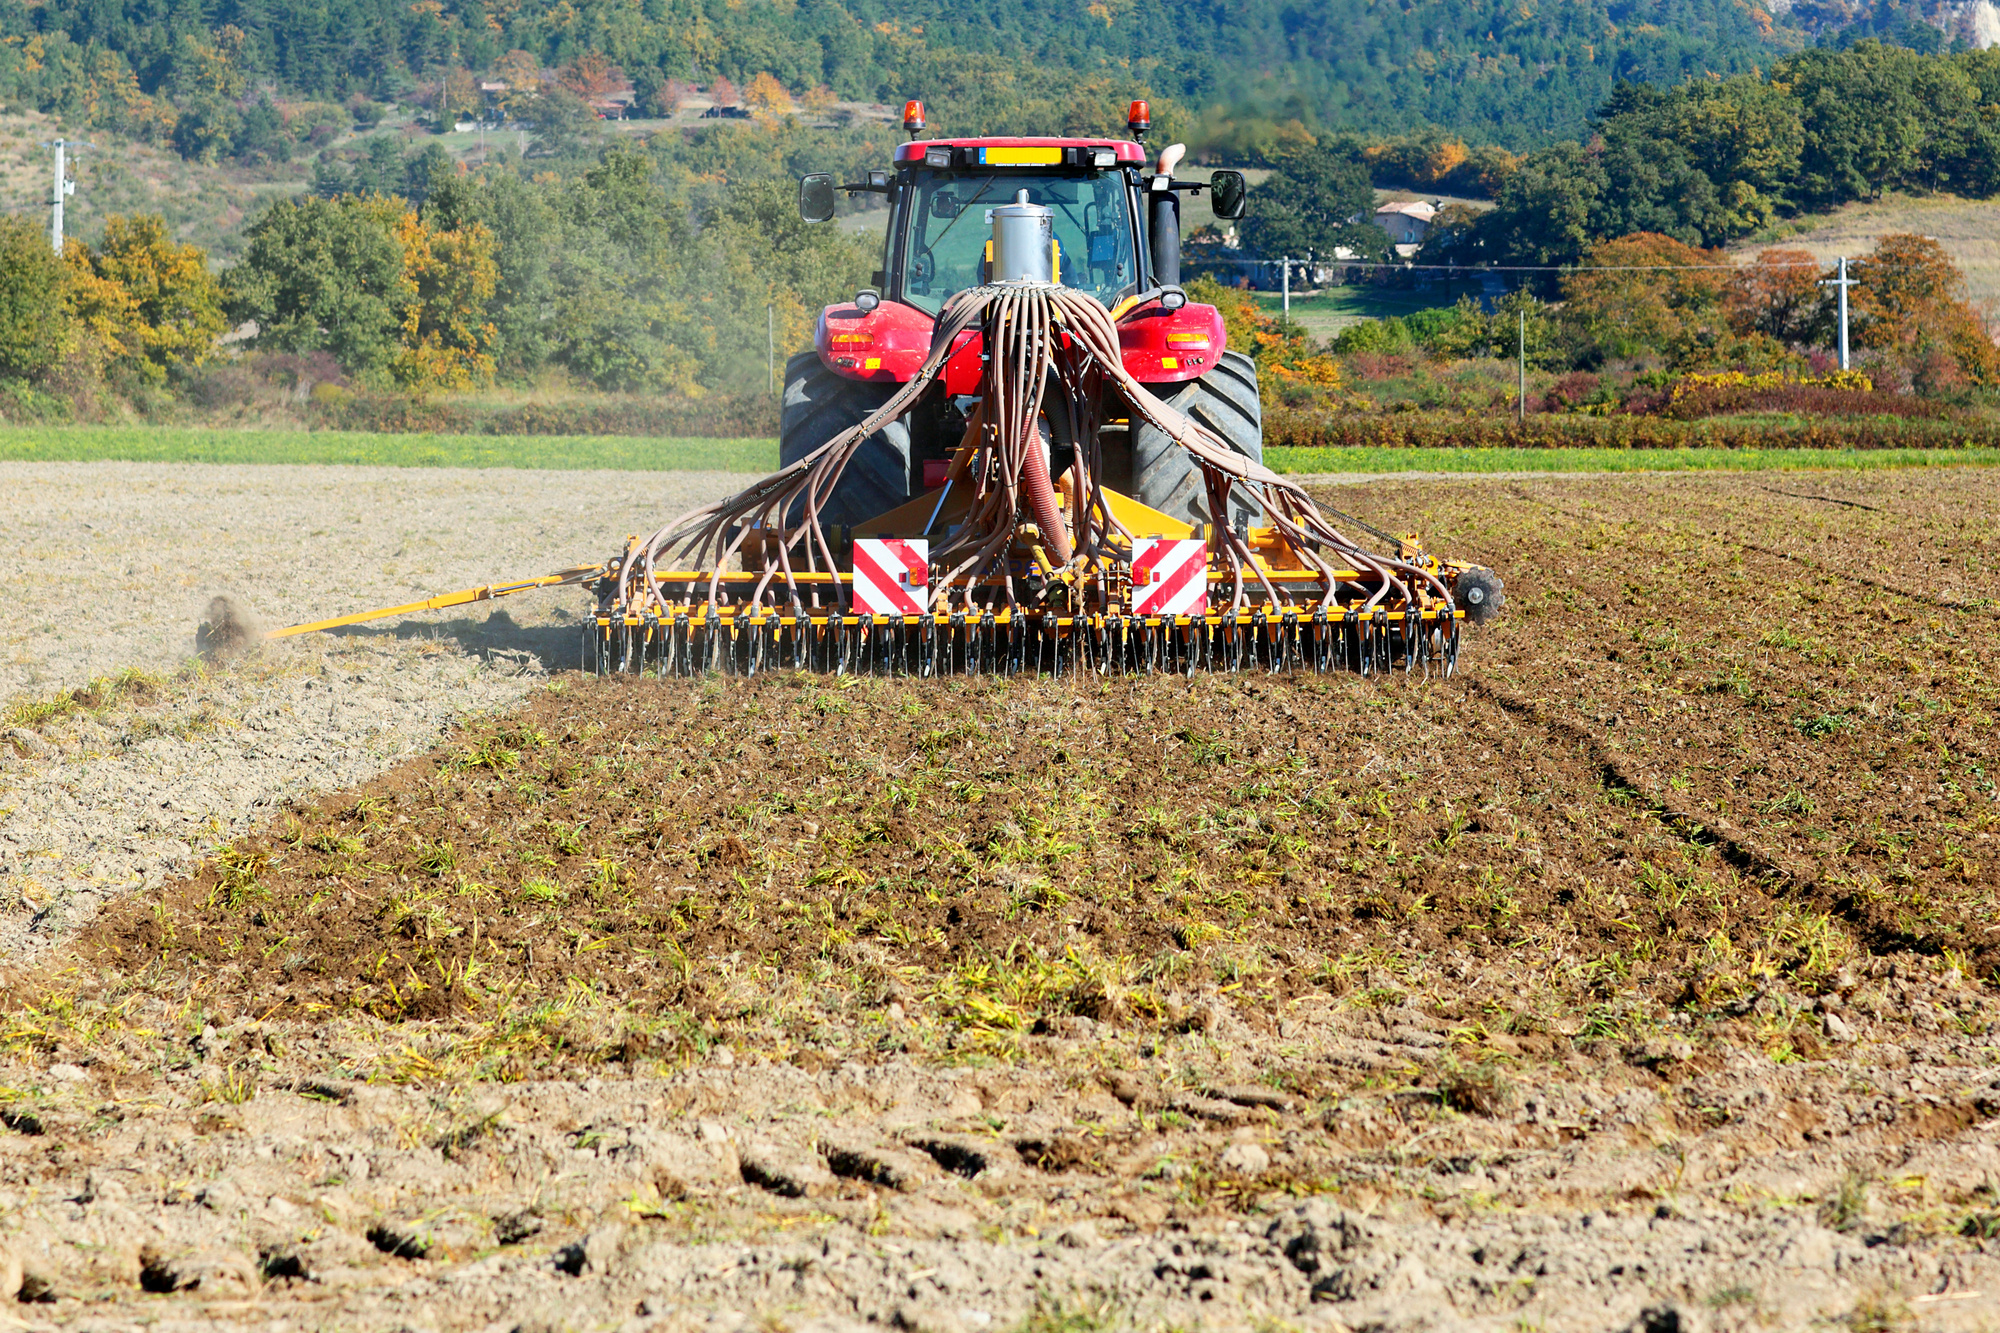
Crop risk has a different clock. It unfolds across a growing season, sometimes field by field. Hail may make the damage visible, while repeated observations show whether a crop rebounds or remains behind.
Forest loss can seem incremental at first: a clearing at the edge of a forest, a road extending farther in, a canopy that does not return. In 2025, 4.3 million hectares of tropical primary forest were lost, more than 11 football fields every minute, according to Global Forest Review.
The cost arrives later, once those changes have turned into losses. Swiss Re recorded 190 natural-catastrophe events in 2025, US$220 billion in economic losses worldwide. Insured losses totalled US$107 billion.
Behind those figures are farms, forests and communities where the warning signs had been accumulating well before the final claim or damage estimate.
A sequence reveals the pattern
A satellite image captures a landscape on one day. A repeated record shows what led to that condition and how it changes afterward, whether the question is burn recovery, forest loss or crop damage.
That context changes the questions decision-makers can ask. A burn scar becomes part of a record of pre-fire conditions and recovery. A hail-damaged field can be assessed against its earlier growth and subsequent performance.
That distinction affects what happens next. A short-lived setback may call for closer observation. A deviation that persists across days or weeks may justify a different assessment, a field visit or an intervention.
This is the value of a time series: it gives a single event the context it needs.
Accuracy gives frequency meaning
Frequency creates a richer record. Accuracy determines whether that record can support a decision.
Satellite systems observe the planet through changing atmospheric conditions and across different sensors. Variations in lighting, viewing geometry, calibration and processing can introduce differences into the data. Those differences can resemble change on the ground.
For a visual record, that distinction may have limited consequence. For an assessment of crop stress, fuel conditions or environmental recovery, it can alter the conclusion.
Science-grade Earth observation addresses this requirement through calibrated, geographically precise and consistent measurement. Each observation needs to relate reliably to the last so that analysts can distinguish a genuine shift in vegetation, moisture or land condition from variation in the data itself.
The same standard applies to AI.
AI can help experts analyze conditions across areas too large to review manually. It can identify patterns across years of observations and direct attention toward emerging signals. Its usefulness depends on the record it learns from. Models trained on inconsistent observations can pick up sensor artifacts and processing differences alongside real environmental patterns.
A dependable time series gives AI a stronger foundation for recognizing the signals that reflect genuine change.
Climate action needs evidence across time
The UN Environment Programme’s latest Limiting Overshoot report describes the period ahead as a dynamic pathway of exceedance, peak warming and eventual decline. Higher peak warming and longer periods of overshoot will bring greater risks for people, economies and ecosystems.
Every fraction of a degree and every year of exposure will shape conditions on the ground. Cutting emissions has to move faster. Meanwhile, the people responsible for land, infrastructure and food production are working with conditions already changing around them.
A continuous record shows whether pressure is persisting and whether recovery lasts. It also gives adaptation a test. After fuel treatments, restoration work or water-management changes, the question is simple: did conditions improve, and did that improvement hold through the next period of stress?
That is the point of measuring change over time: to give people something to work with before the damage figure arrives, and a way to judge their choices afterward. In an overshoot world, waiting for the final damage figure is waiting too long.
Whether you are a government agency monitoring environmental change, an agricultural business managing crop risk, an insurer assessing exposure or a researcher building a long-term record of change, EarthDaily brings together data and analytics to help answer the questions in front of you.
About the Author