
.jpg?width=289&height=168&name=Data%20Use%20cases%20(1).jpg)
California has declared a statewide emergency to prepare for potentially record-breaking El Niño storms this winter. The announcement follows a World Meteorological Organization warning that El Niño is expected to strengthen into a very strong event, increasing the risks of floods, drought and extreme heat into 2027.
That warning arrives as the U.S. Corn Belt moves into harvest season, with damage from summer storms still part of the production picture. The experiences of Iowa and Nebraska show what agricultural assessment requires after severe weather passes: identifying which fields changed, how many acres were involved and how crop conditions developed during the weeks that followed.
EarthDaily combined weather information, field boundaries and repeat satellite observations to follow that progression after high winds and hail struck both states this summer.
Iowa: A field-level signal emerges
On August 7, a National Weather Service survey documented two tornadoes and two wind-and-hail damage swaths across eastern Iowa.
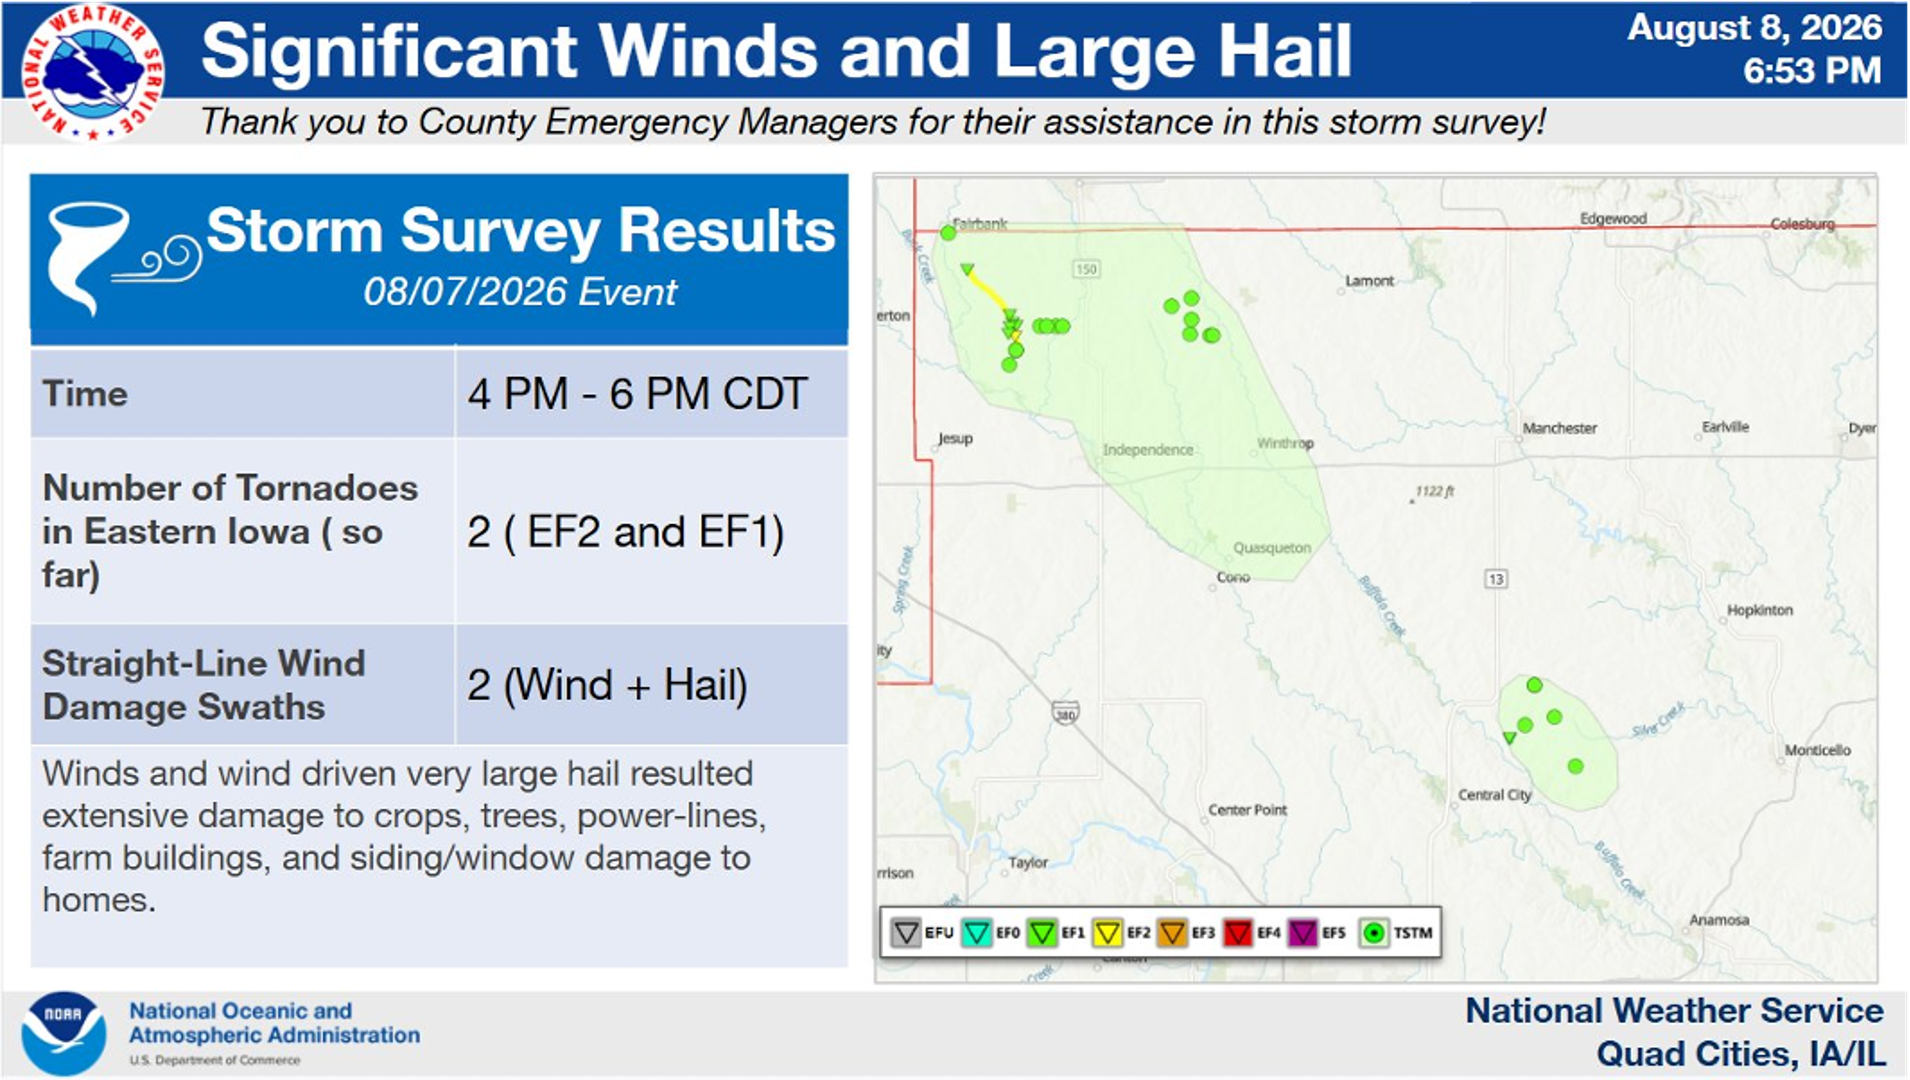 The National Weather Service survey mapped two tornadoes and two wind-and-hail damage swaths across eastern Iowa on August 7.
The analysis then compared vegetation conditions before and after the storm using Sentinel-2 observations. In one selected field, vegetation change was visible in the next clear observation, acquired the day after the storm. Thirty-five percent of the field’s acreage recorded an NDVI decrease of 0.30 or more.
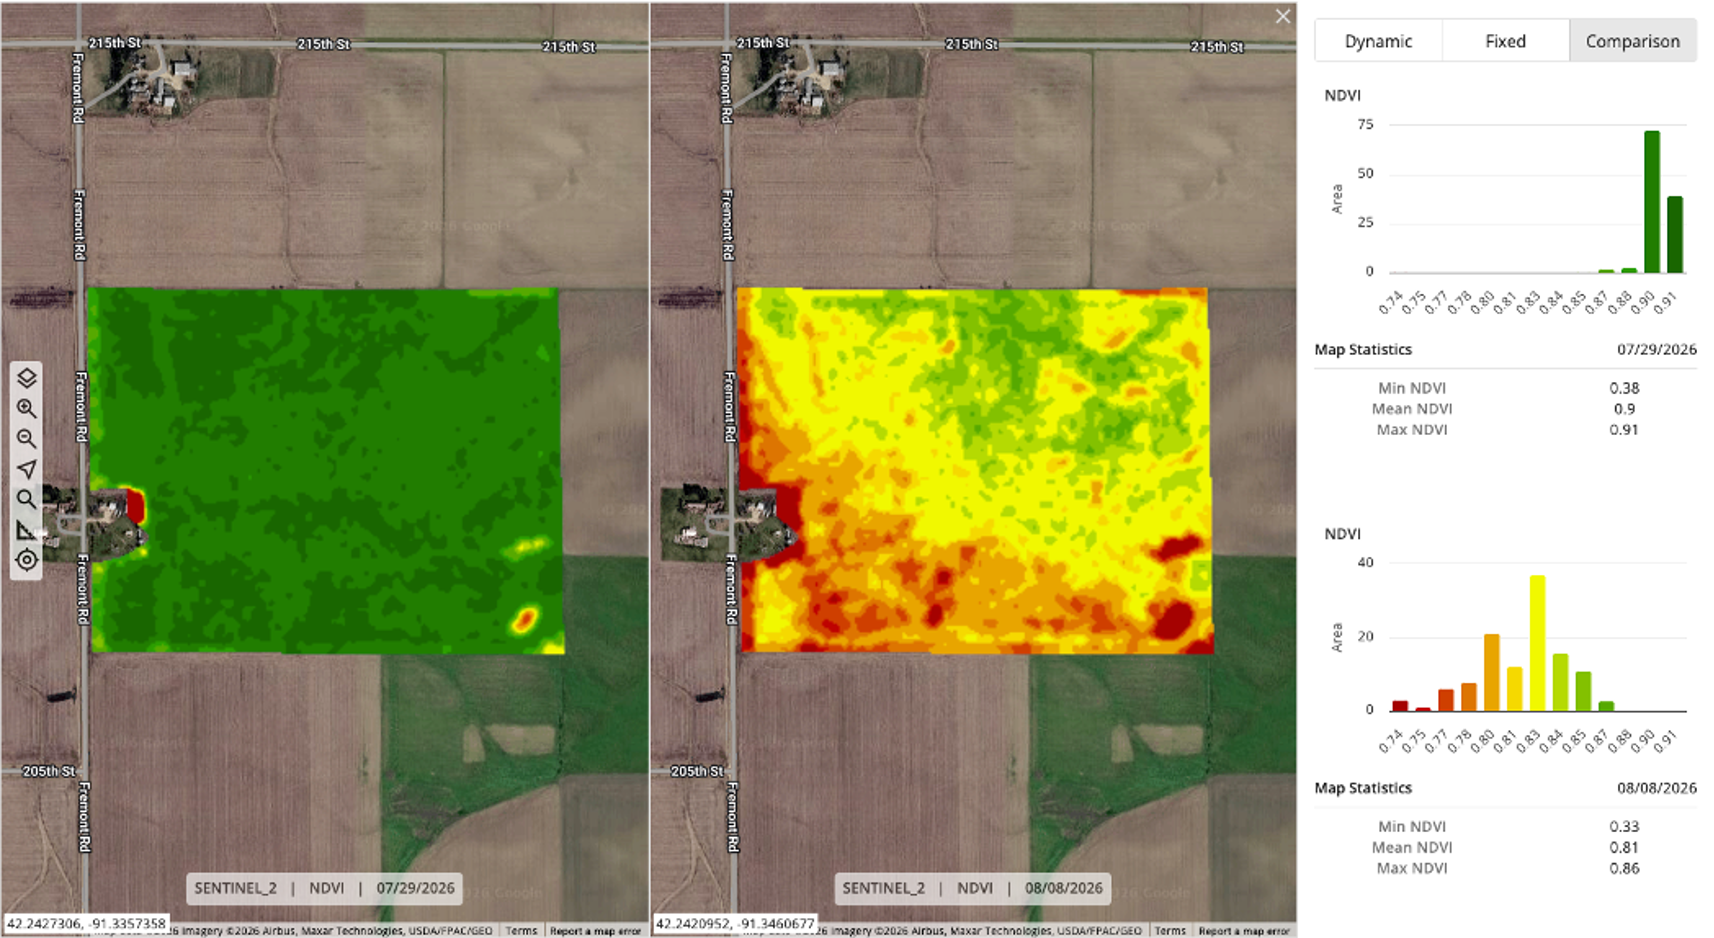 Analysis of Sentinel-2 data indicates a sharp decline in vegetation condition, with 35% of the field’s acreage recording an NDVI decrease of 0.30 or more.
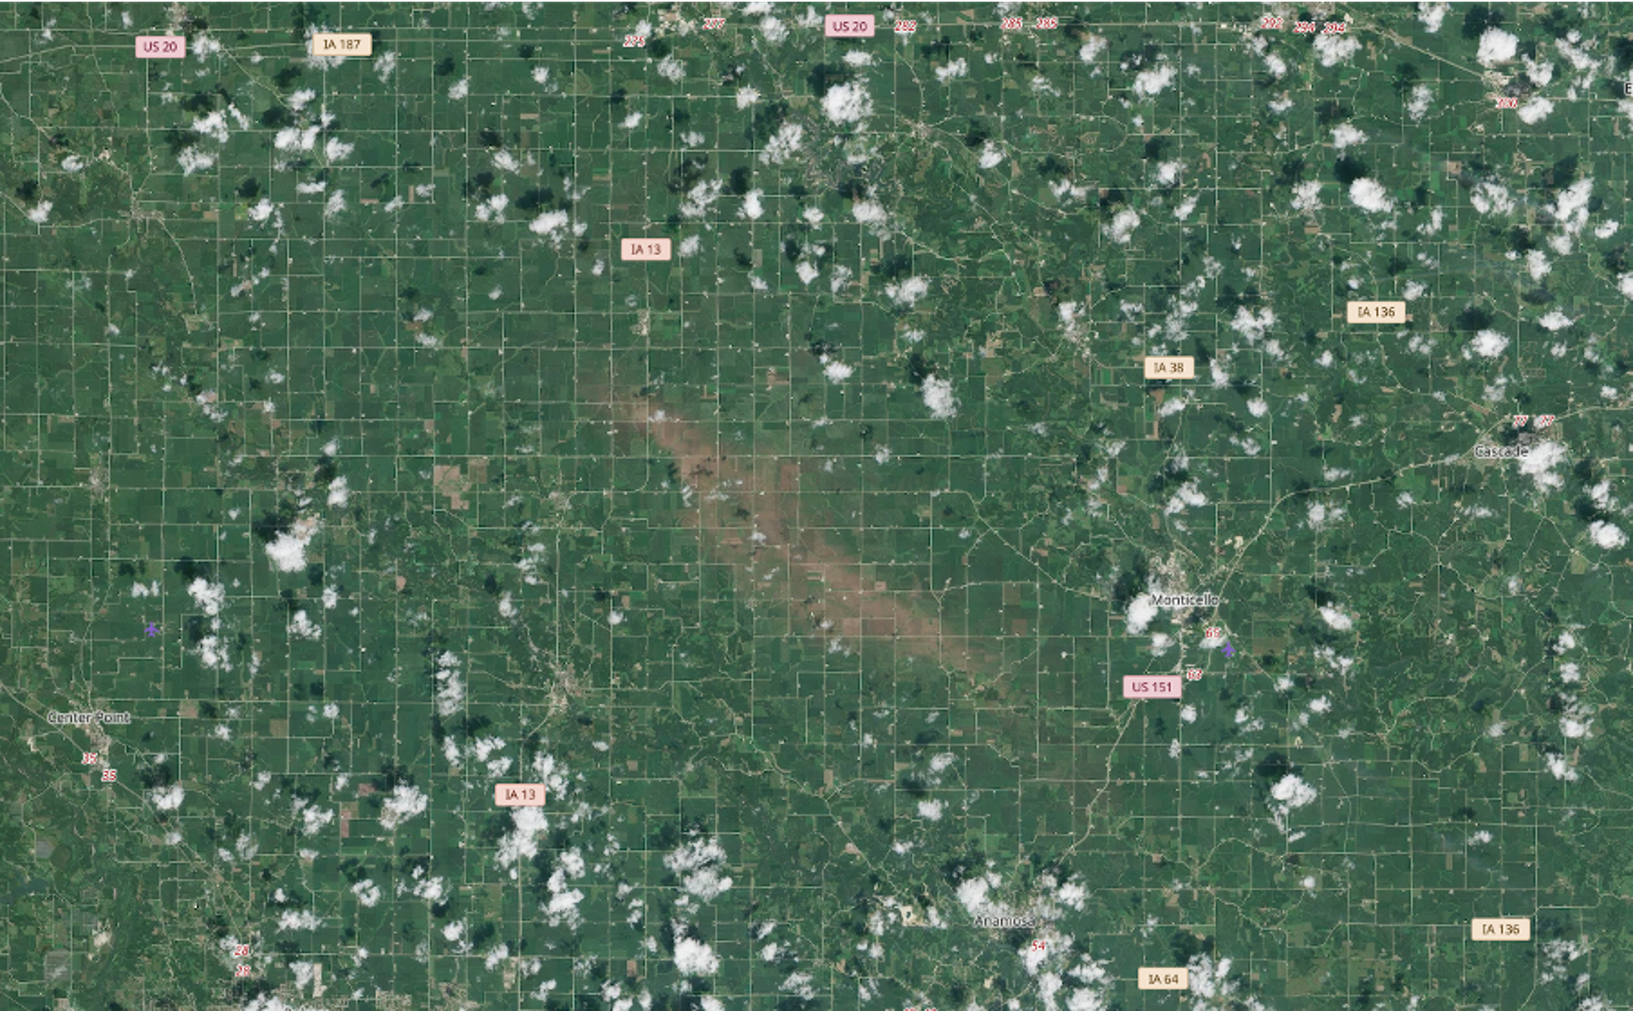
Anecdotally, the August 23 image, acquired a couple of weeks later, showed a broad brown swath extending across multiple fields, visible even in the simplest true-color imagery as a bare-soil scar. In the example above, 43 of the field’s 120 acres fell within the scar.
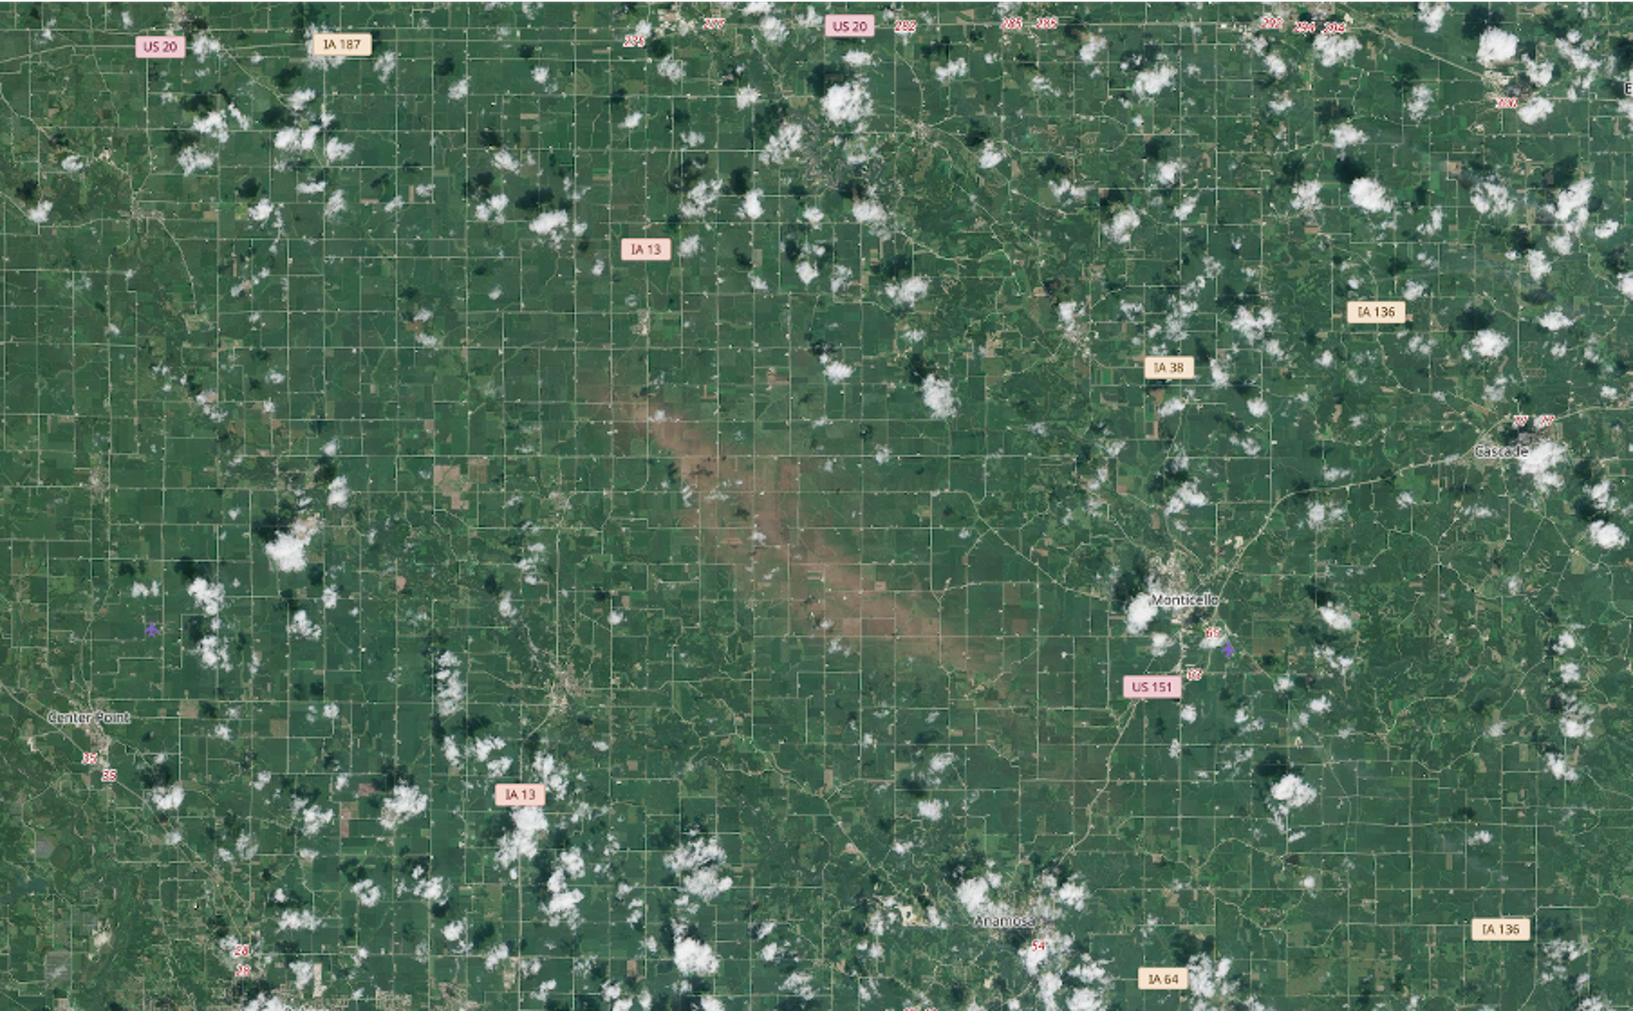 The broad brown swath near the center of this Sentinel-2 image is a bare-soil scar extending across multiple fields in eastern Iowa, just over two weeks after the storm.
Nebraska: Following the crop signal through the season
Earlier in summer, high winds and hail struck farmland near Grand Island and Hastings. EarthDaily compared conditions before the June 20 storm with repeat observations collected during the following month. The regional sequence showed a broad band of vegetation change along the storm corridor.
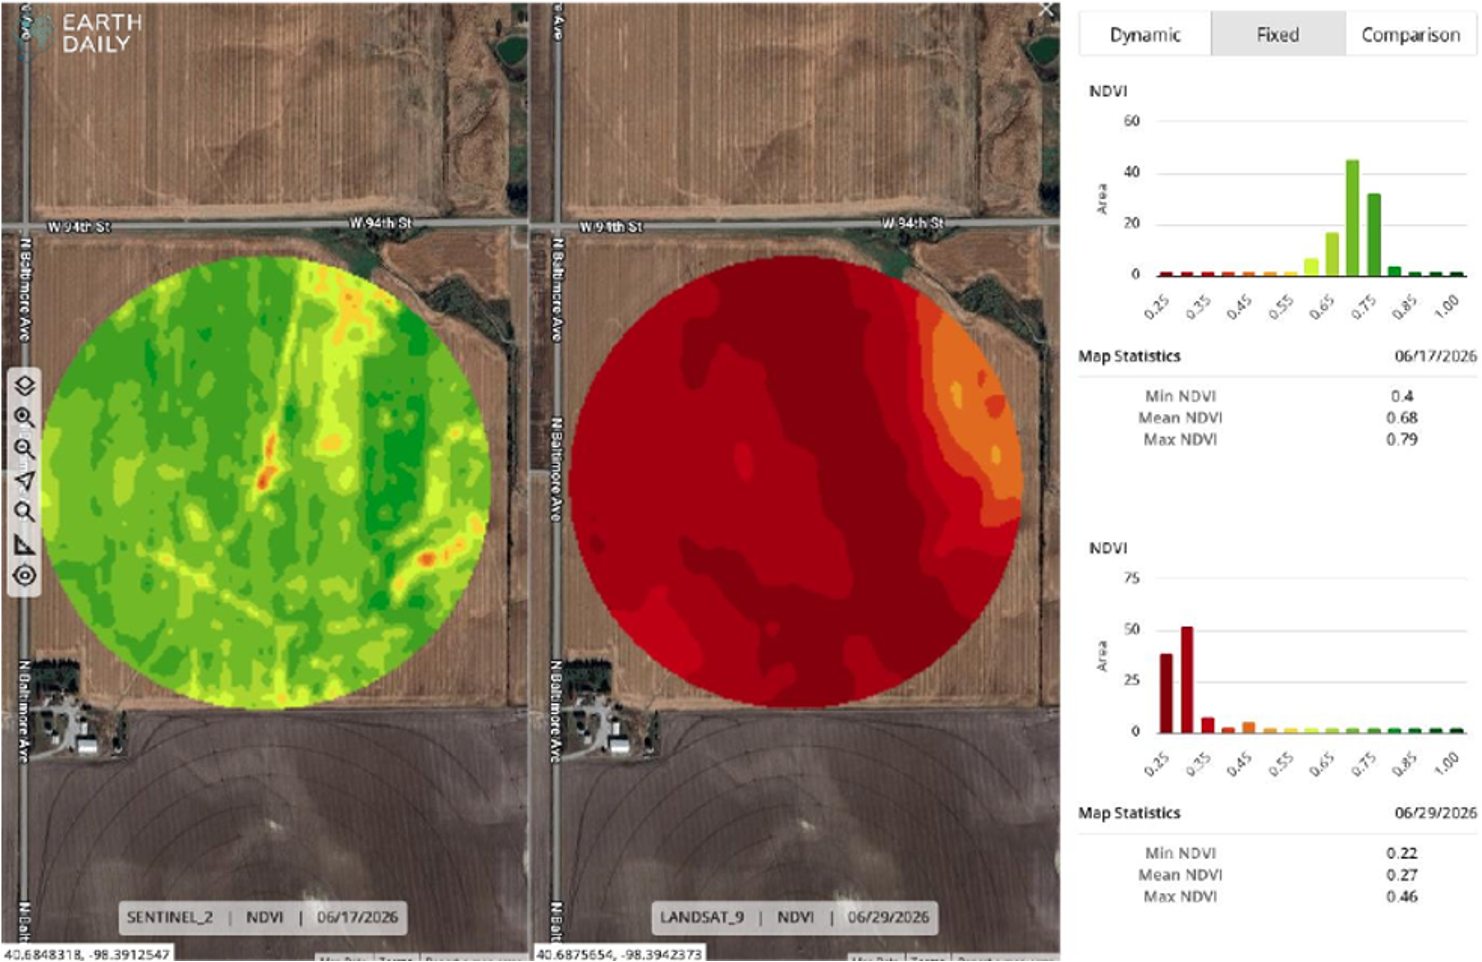 Harmonized Sentinel-2 and Landsat 9 observations compares June 17 with June 29, nine days after the storm.
The field-level analysis showed how sharply conditions had changed. In one selected field, mean NDVI fell from 0.68 on June 17 to 0.27 on June 29. The vegetation graphs captured the initial decline and the growth of a replacement crop after July 10.
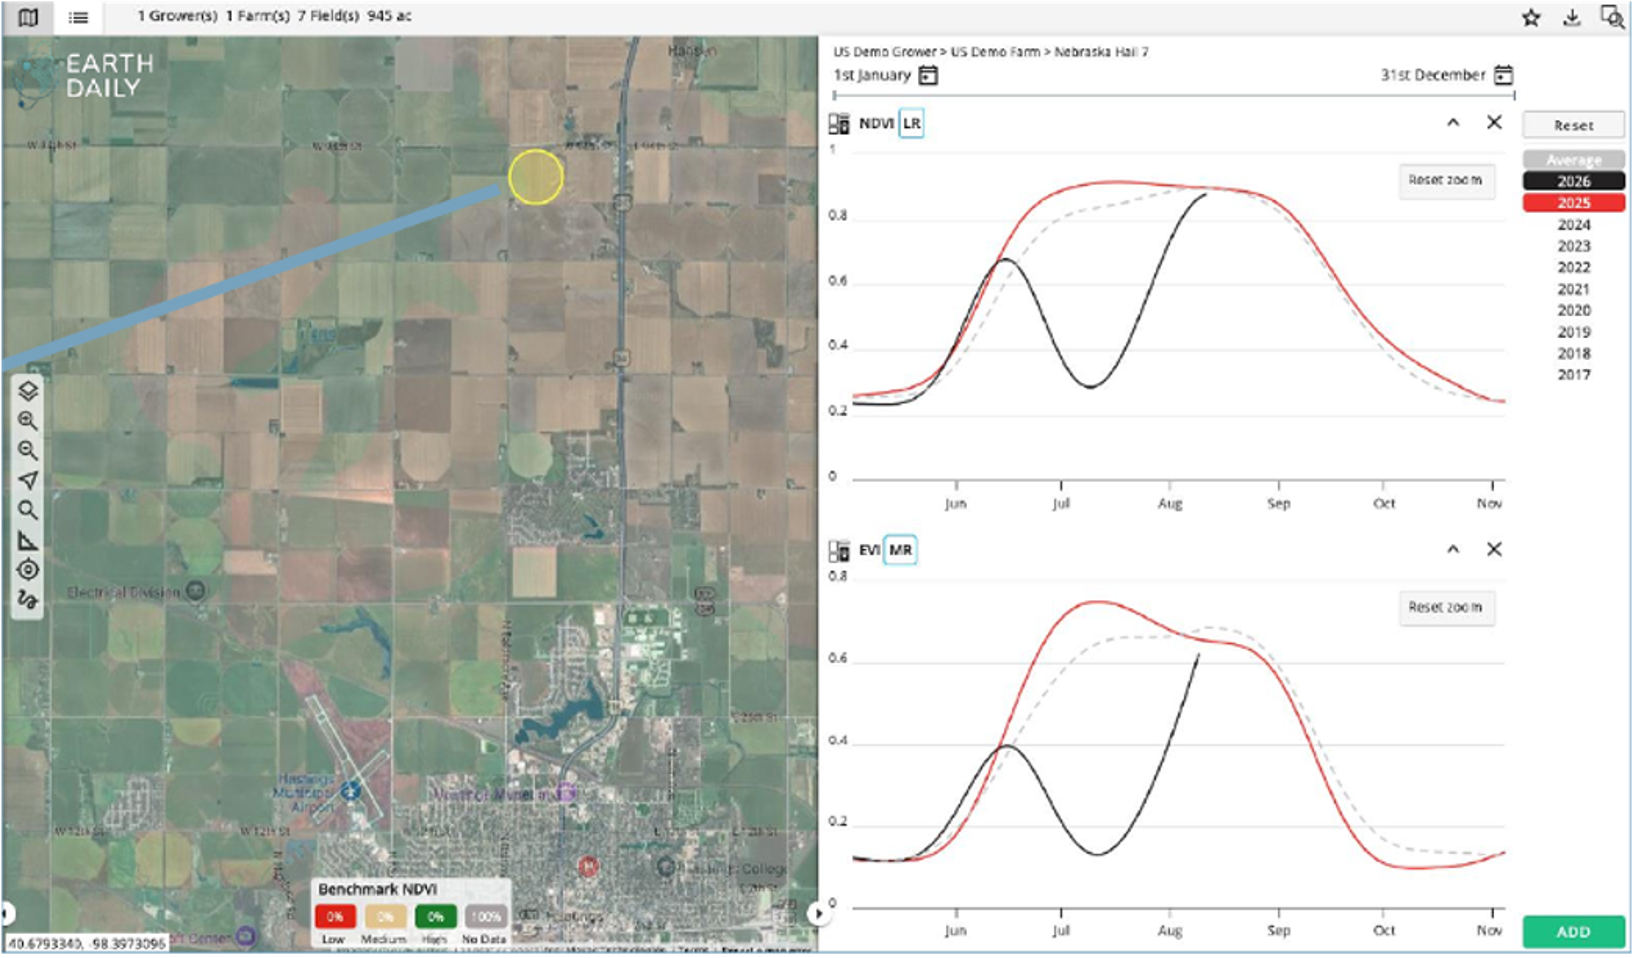 EarthDaily’s NDVI and EVI graphs show the 2026 field signal dropping after June 20. The rise after July 10 reflects growth from the replacement crop.
The analysis then extended beyond the individual field. Using 6-by-6-mile township grids, field boundaries and crop identification, it estimated that 22% of corn acreage in one affected township was no longer standing as of July 15.
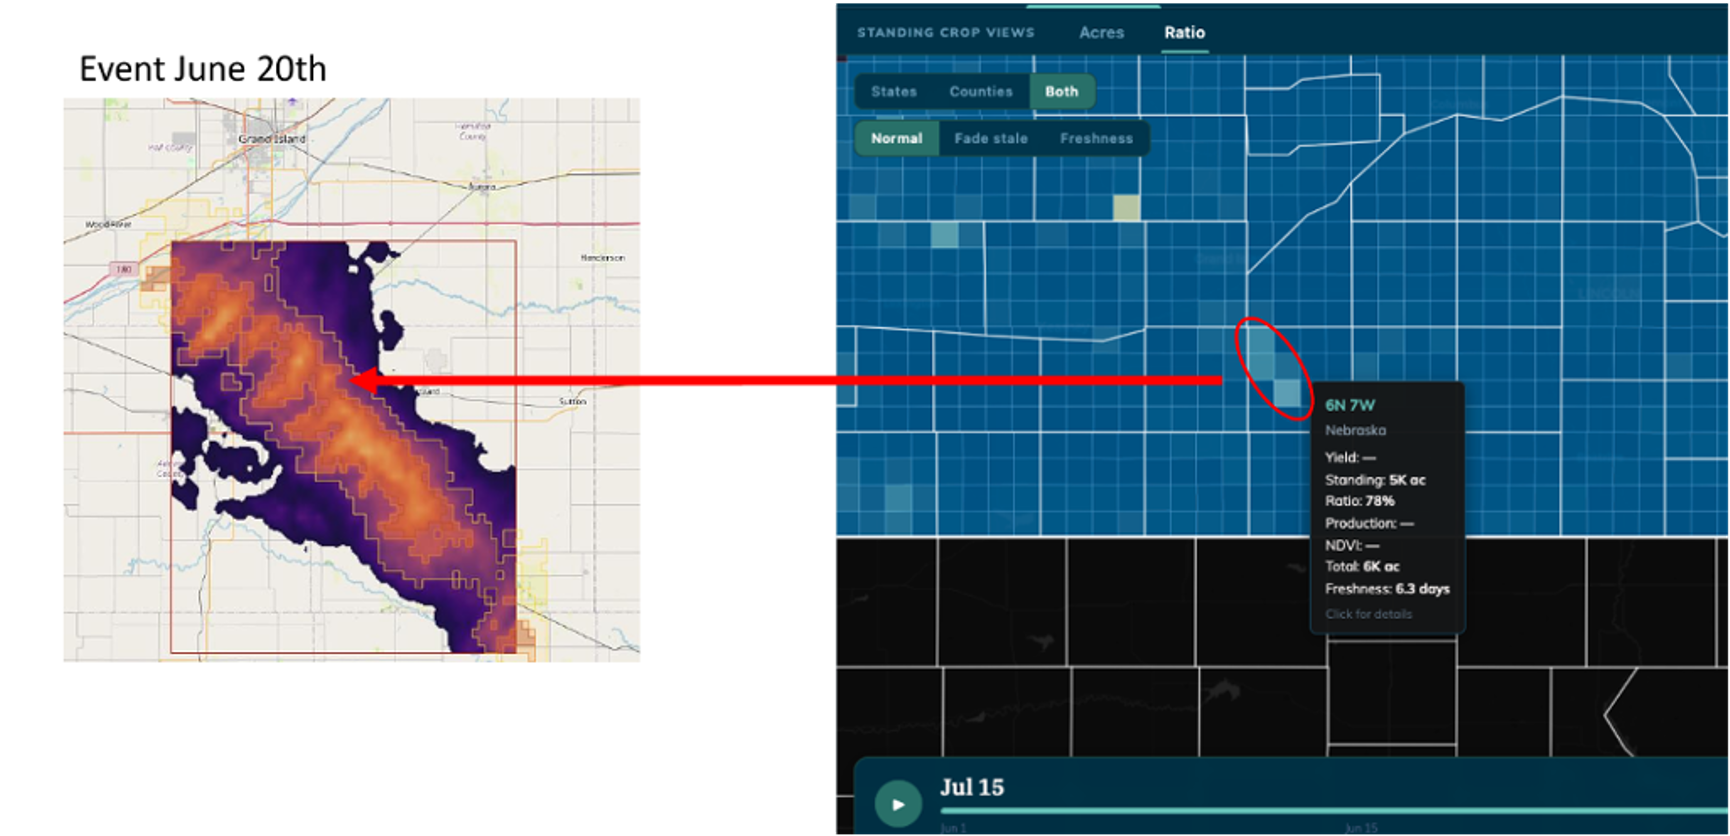 An estimated 22% of corn acreage in the selected township was no longer standing as of July 15.
Agricultural intelligence at field scale
The Iowa and Nebraska cases show how agricultural assessment can progress from a storm footprint to changes within individual fields and then across a wider production area.
As California prepares for potentially record-breaking El Niño storms, the same approach could help agricultural teams identify where field conditions changed after an event, estimate the acreage involved and follow how those conditions develop in subsequent observations.
EarthDaily combines crop identification, consistent field boundaries and repeat vegetation measurements to create a comparable record across large agricultural areas. This field-level context can support insurers, lenders, commodity teams and agricultural businesses as they assess yield and portfolio exposure and determine where closer review is needed.
About the Author