.jpg?width=289&height=168&name=Data%20Use%20cases%20(1).jpg)
EDC imagery shown in natural color and false color, highlighting how different spectral views can reveal surface features and conditions more clearly.
Change detection is often treated as a comparison problem. Take two observations, measure the difference, and identify what changed. In practice, the harder problem is knowing whether that difference is real.
(This is the third blog in our science-grade data series. The first two articles looked at what science-grade Earth observation data means and how EarthDaily’s constellation is built to deliver it. This piece looks at why that foundation matters for reliable change detection.)
No satellite captures the Earth under perfectly identical conditions every time. Light changes, atmospheric conditions change, the viewing angle changes. Sensor behavior can change too. Those differences all show up in what gets recorded. When those variations enter the data, they can look like change even when nothing on the ground has shifted.
At the same time, real change is often subtle. Early crop stress, gradual moisture loss, or slow land degradation do not produce large signals. The signal exists, but it is small.
Both effects show up in the data. Without stable measurement, they are difficult to separate.
What Change Detection Actually Assumes
Change detection only works if observations are comparable over time. That assumption sits behind decades of Earth observation system design. Public missions like Landsat were designed for continuity over time, with calibration built in from the start. Sentinel-2 follows the same logic, using a sun-synchronous orbit so images are captured under broadly consistent lighting and viewing conditions from one pass to the next.

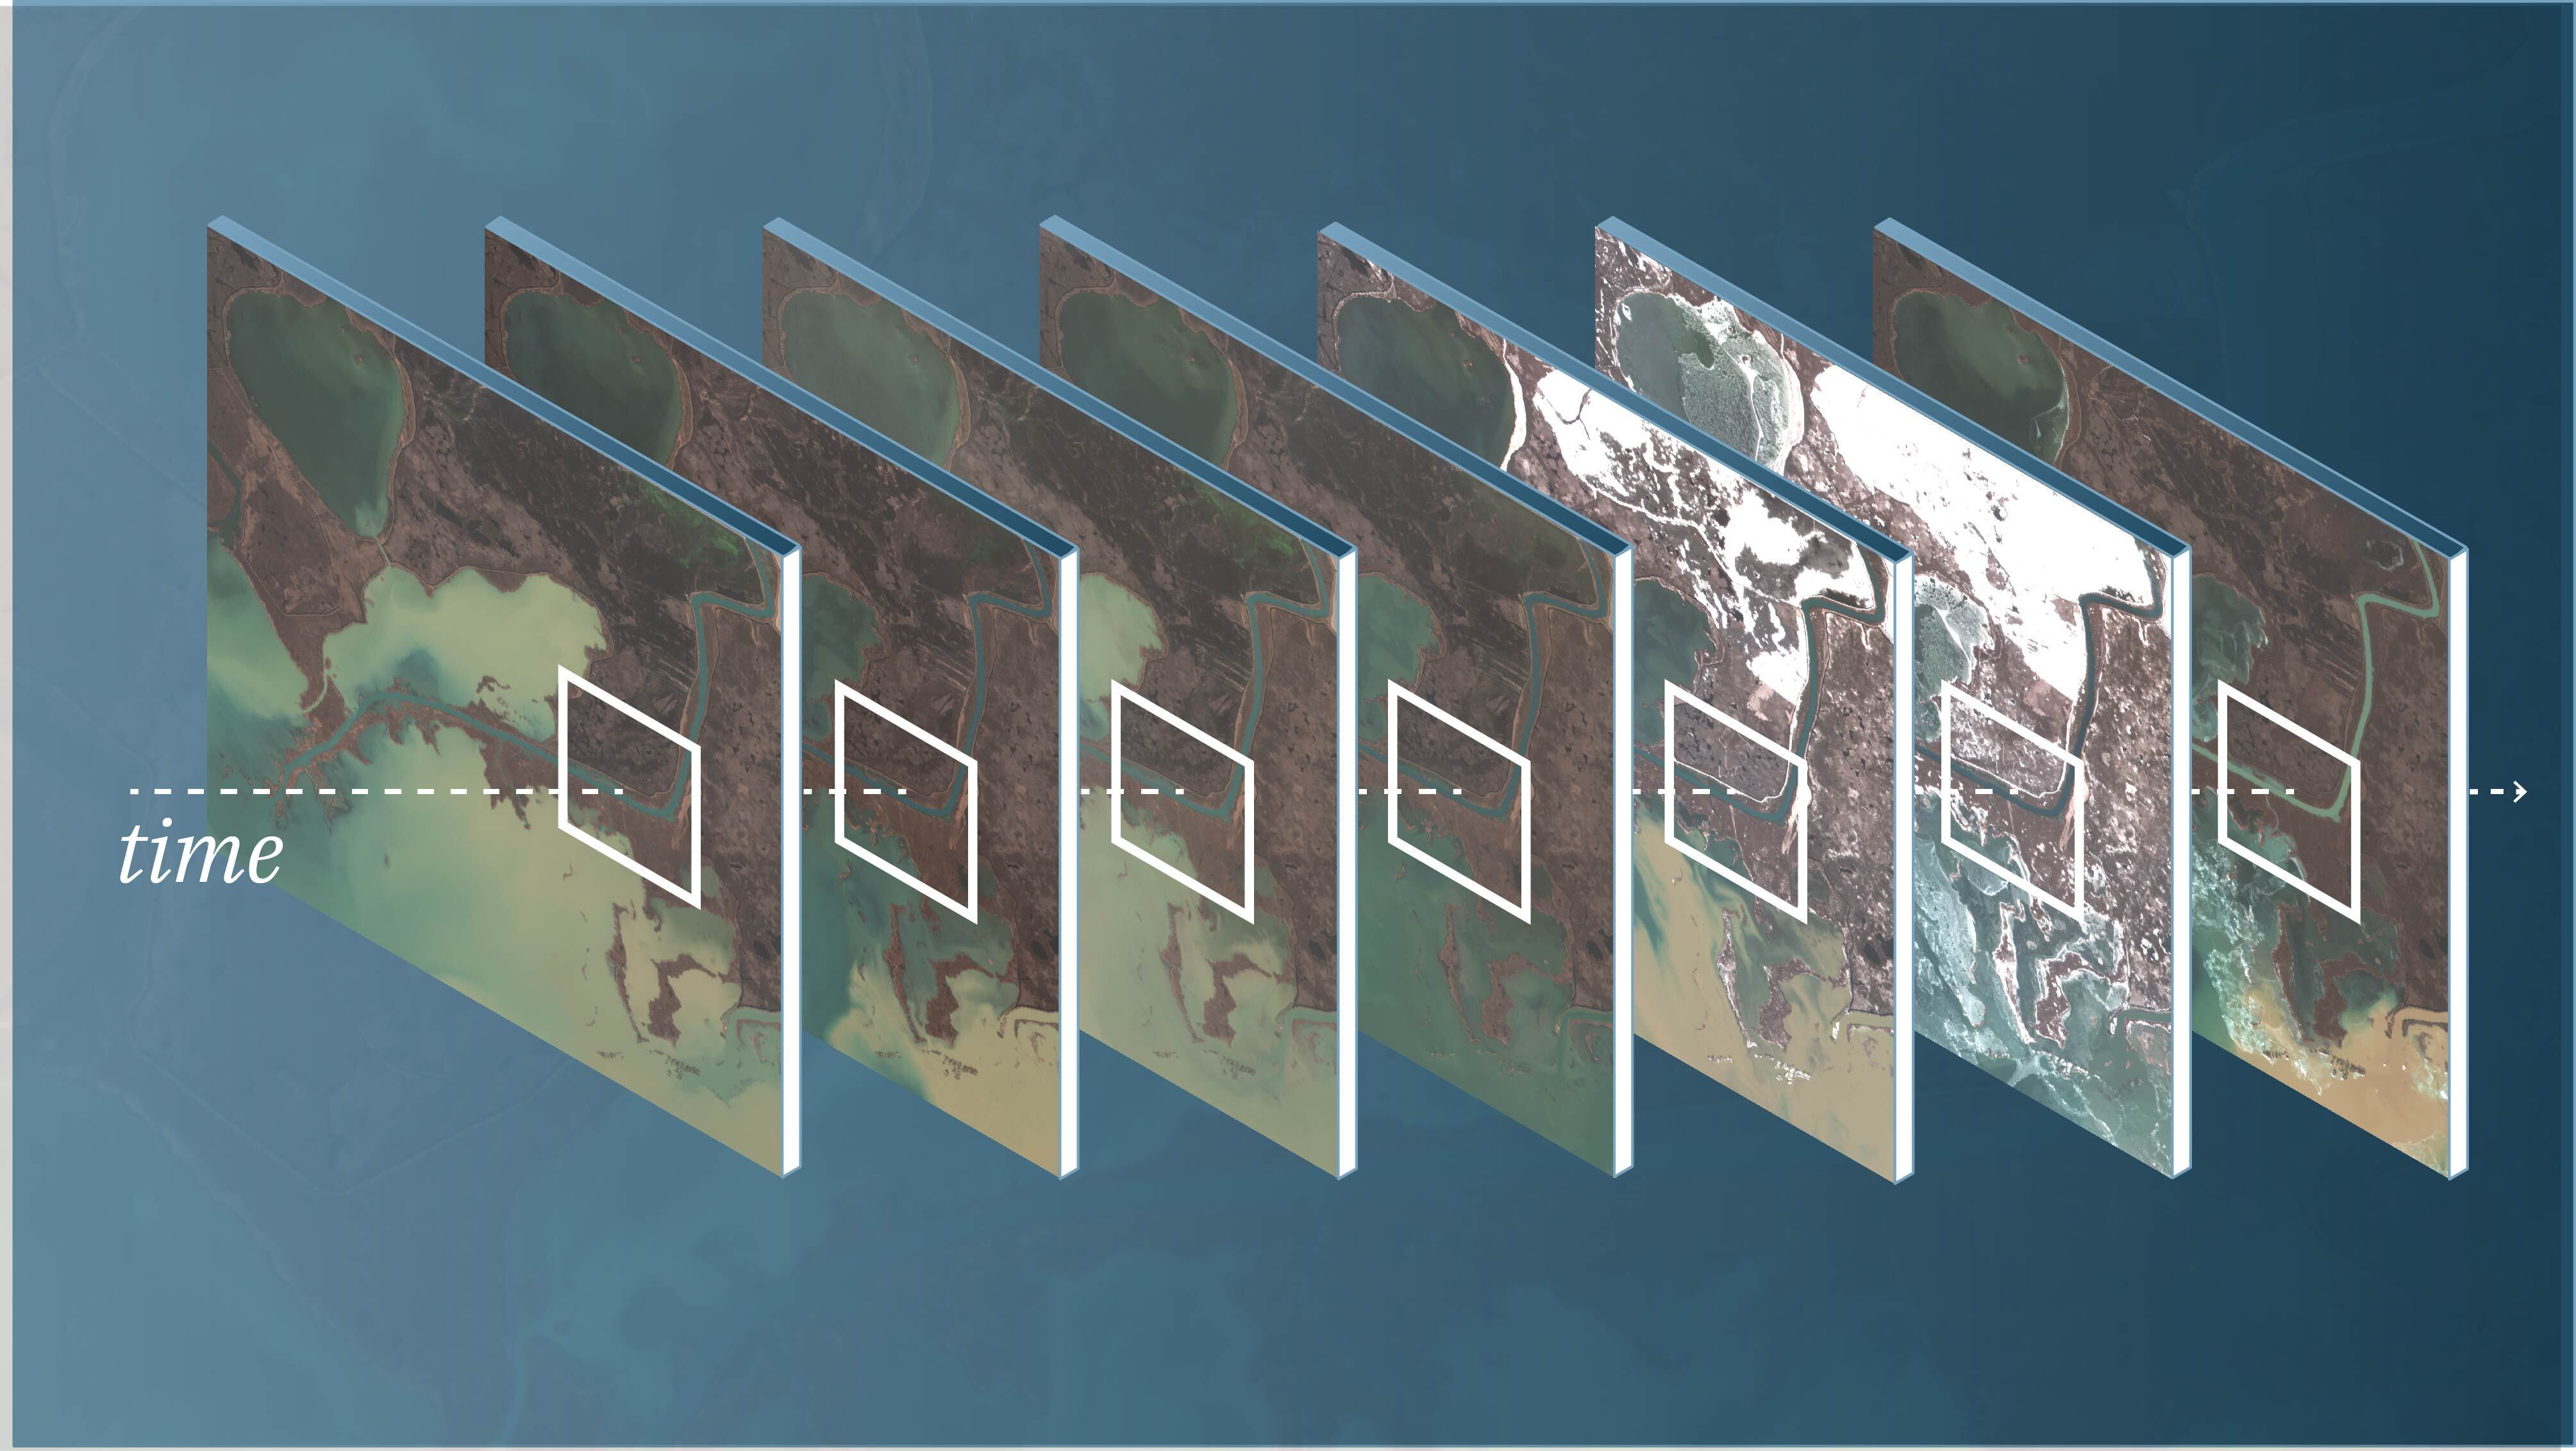
Time-series imagery showing why consistency matters for change detection: each observation must be comparable enough to distinguish real surface change from variation in observation conditions.
NASA describes its standard data products as internally consistent, well-calibrated records of Earth’s geophysical properties, suitable for scientific research and applications. The emphasis is on consistency across time, not just accuracy in a single observation.
This is also reflected in Analysis Ready Data frameworks developed through the Committee on Earth Observation Satellites (CEOS). Data is processed to be radiometrically consistent, geometrically aligned, and ready for time-series analysis without requiring repeated normalization.
Accurate change detection depends on that baseline.
How Change Detection Goes Wrong
When measurements are not stable, the failure modes are predictable:
- False positives: Differences in atmosphere, illumination, or viewing angle appear as change. A field may look different because of haze rather than crop condition. Variations in geometry can shift vegetation indices enough to suggest change where none exists.
- False negatives: Real signals can be missed. Early vegetation stress or gradual drying often produces small changes. If measurement variability is of the same magnitude, those signals disappear.
- Drift over time: Over time, small differences in calibration, sensor response, and processing begin to show up in the data. What looks like a trend may partly come from the data itself, making it harder to interpret change with confidence.
Why Science-Grade Data Changes the Outcome
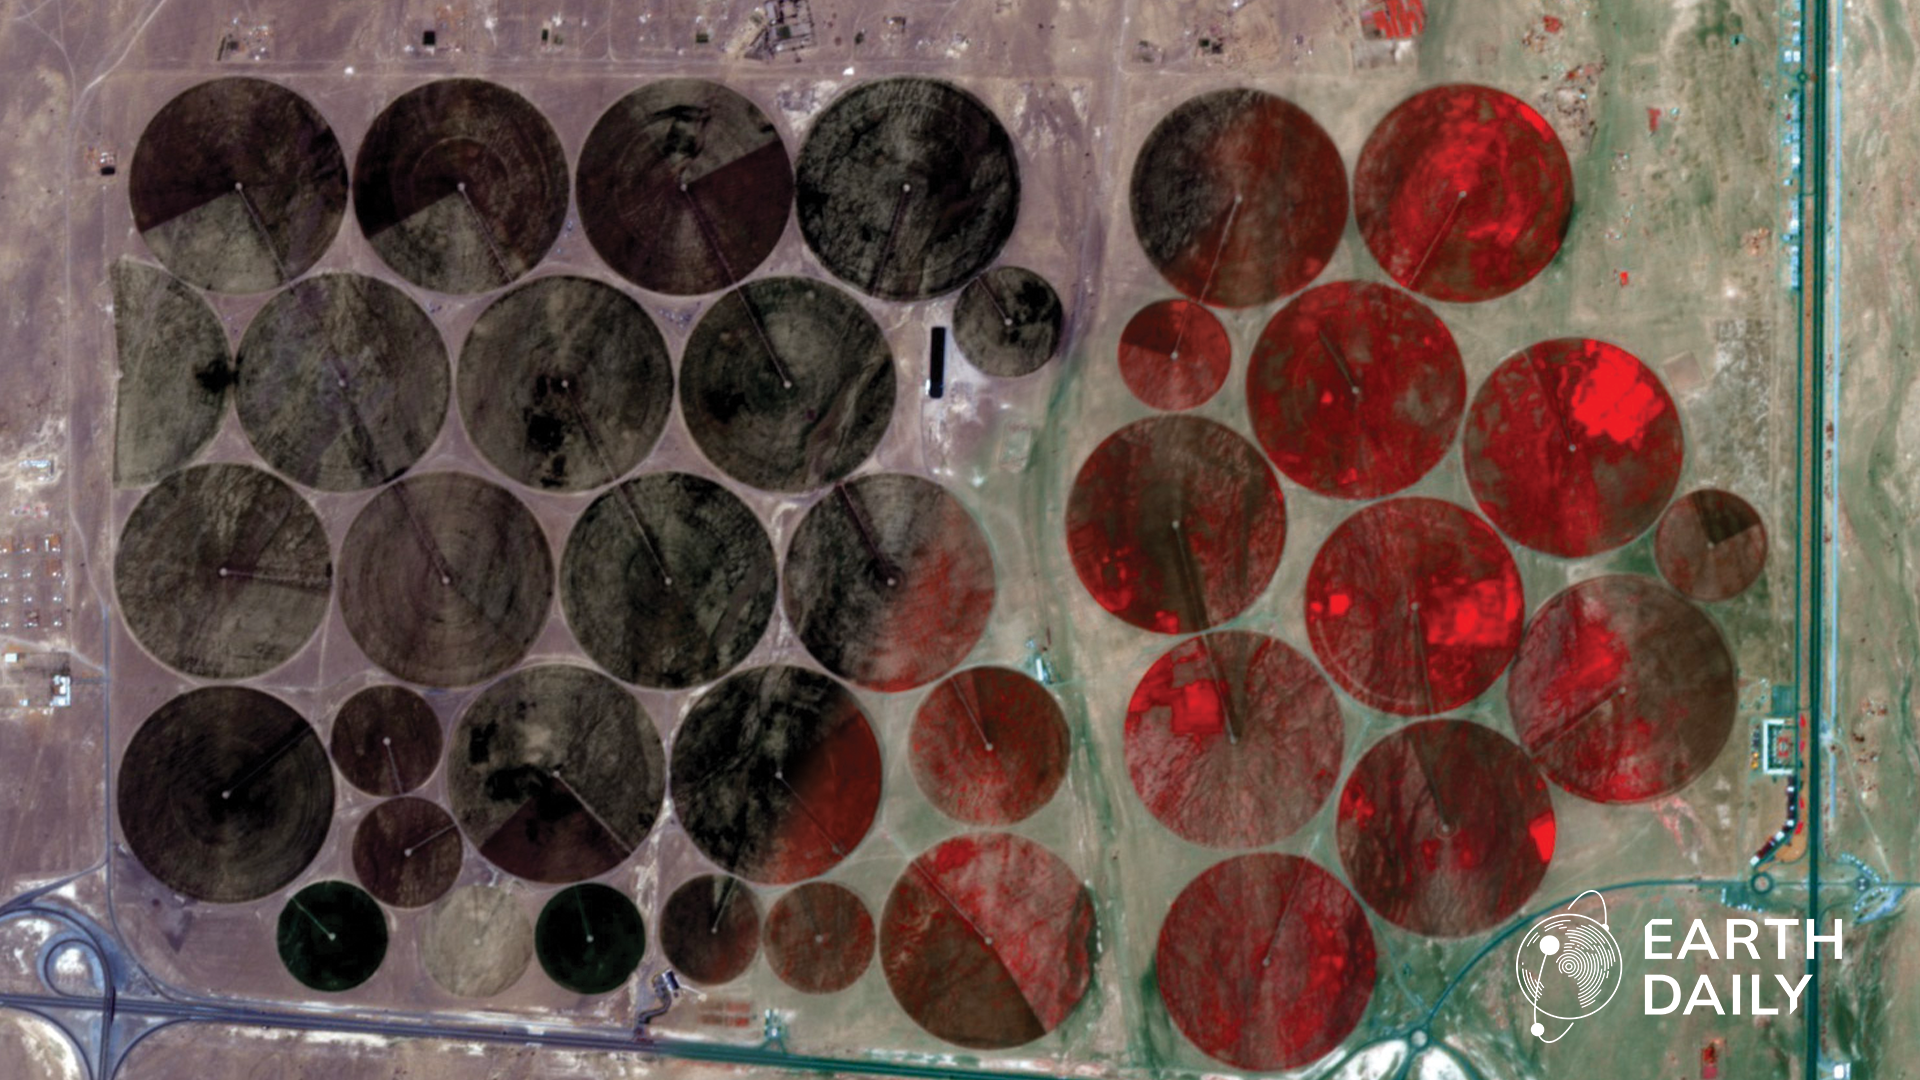
Science-grade data reduces variation before it enters the analysis. Calibration keeps measurements stable as sensors age and conditions change. Geometric consistency limits variation introduced by how the Earth is observed. Spectral depth helps separate surface properties from atmospheric effects while validation ties measurements to independent observations, so uncertainty is understood rather than assumed.
This is why national agencies invest in consistent, harmonized datasets. Landsat Analysis Ready Data and Harmonized Landsat–Sentinel products are designed so observations can be used together over time without rebuilding the baseline for each analysis.
The sequence is consistent: measurement stability first, change detection second.
EarthDaily’s approach follows the same logic. The data is structured as a measurement layer, designed to remain consistent across time and conditions. Daily acquisition, controlled viewing geometry, spectral depth, and pre-processed outputs are all aimed at reducing variability before the data is used.
Where This Shows Up in Practice
The impact becomes clear when change detection is used in operational systems, where decisions depend on whether a signal can be trusted.
-
Agriculture: Crop stress builds gradually. Early shifts in moisture or canopy condition are small and often short-lived. If those signals move because of observation conditions rather than actual crop health, early indicators are missed or misread. That affects irrigation timing, input use, and yield forecasts. At a global level, the pressure is significant. FAO estimates that plant pests and diseases reduce global crop yields by 20 to 40 percent each year, which makes early, reliable detection more valuable.
-
Forestry and environmental monitoring: Forests are always changing, even under normal conditions. Season, moisture, and light all affect how vegetation appears from one observation to the next. The real task is separating that natural variation from actual degradation or loss. With Global Forest Watch reporting millions of hectares of forest loss globally each year, that distinction depends on consistent measurement over time.
- Mining and resource monitoring: Change is often slower and more incremental on mining sites. Tailings areas expand, surface material shifts, and moisture conditions in storage zones vary over time. These changes may be subtle in any single observation, but they become meaningful when they can be tracked consistently.
- Insurance and risk assessment: Timing and measurement are crucial in insurance. Flood boundaries, burn severity, and land condition must be measured consistently, and inconsistencies make it harder to assess damage and compare events over time. Global insured losses from natural catastrophes have exceeded $100 billion for five consecutive years, making reliable signals increasingly important.
- Energy systems and utilities: Monitoring infrastructure depends on detecting change across wide areas – vegetation encroachment, land movement, or surface conditions affecting access. These signals are often subtle and distributed. If measurements vary between observations, it becomes difficult to identify what actually changed.
- Infrastructure and built environments: Construction activity and urban expansion often happen incrementally. Tracking these changes requires consistent measurement across time, and differences in acquisition conditions can alter how surfaces appear, making it harder to distinguish real change.
- Government programs: Public-sector monitoring depends on consistency at scale. Land use tracking, agricultural reporting, and resource management rely on data that holds up across regions and time periods. If the baseline shifts, comparisons across jurisdictions become difficult.
- Defense and intelligence: As one of the heaviest users of Earth observation data, it is critical for defense and intelligence departments to deal with data that is reliable. Detecting activity often depends on small signals – surface disturbance, movement patterns, or incremental infrastructure changes. When observations vary from pass to pass because of viewing conditions rather than actual activity, those signals become harder to interpret with confidence.
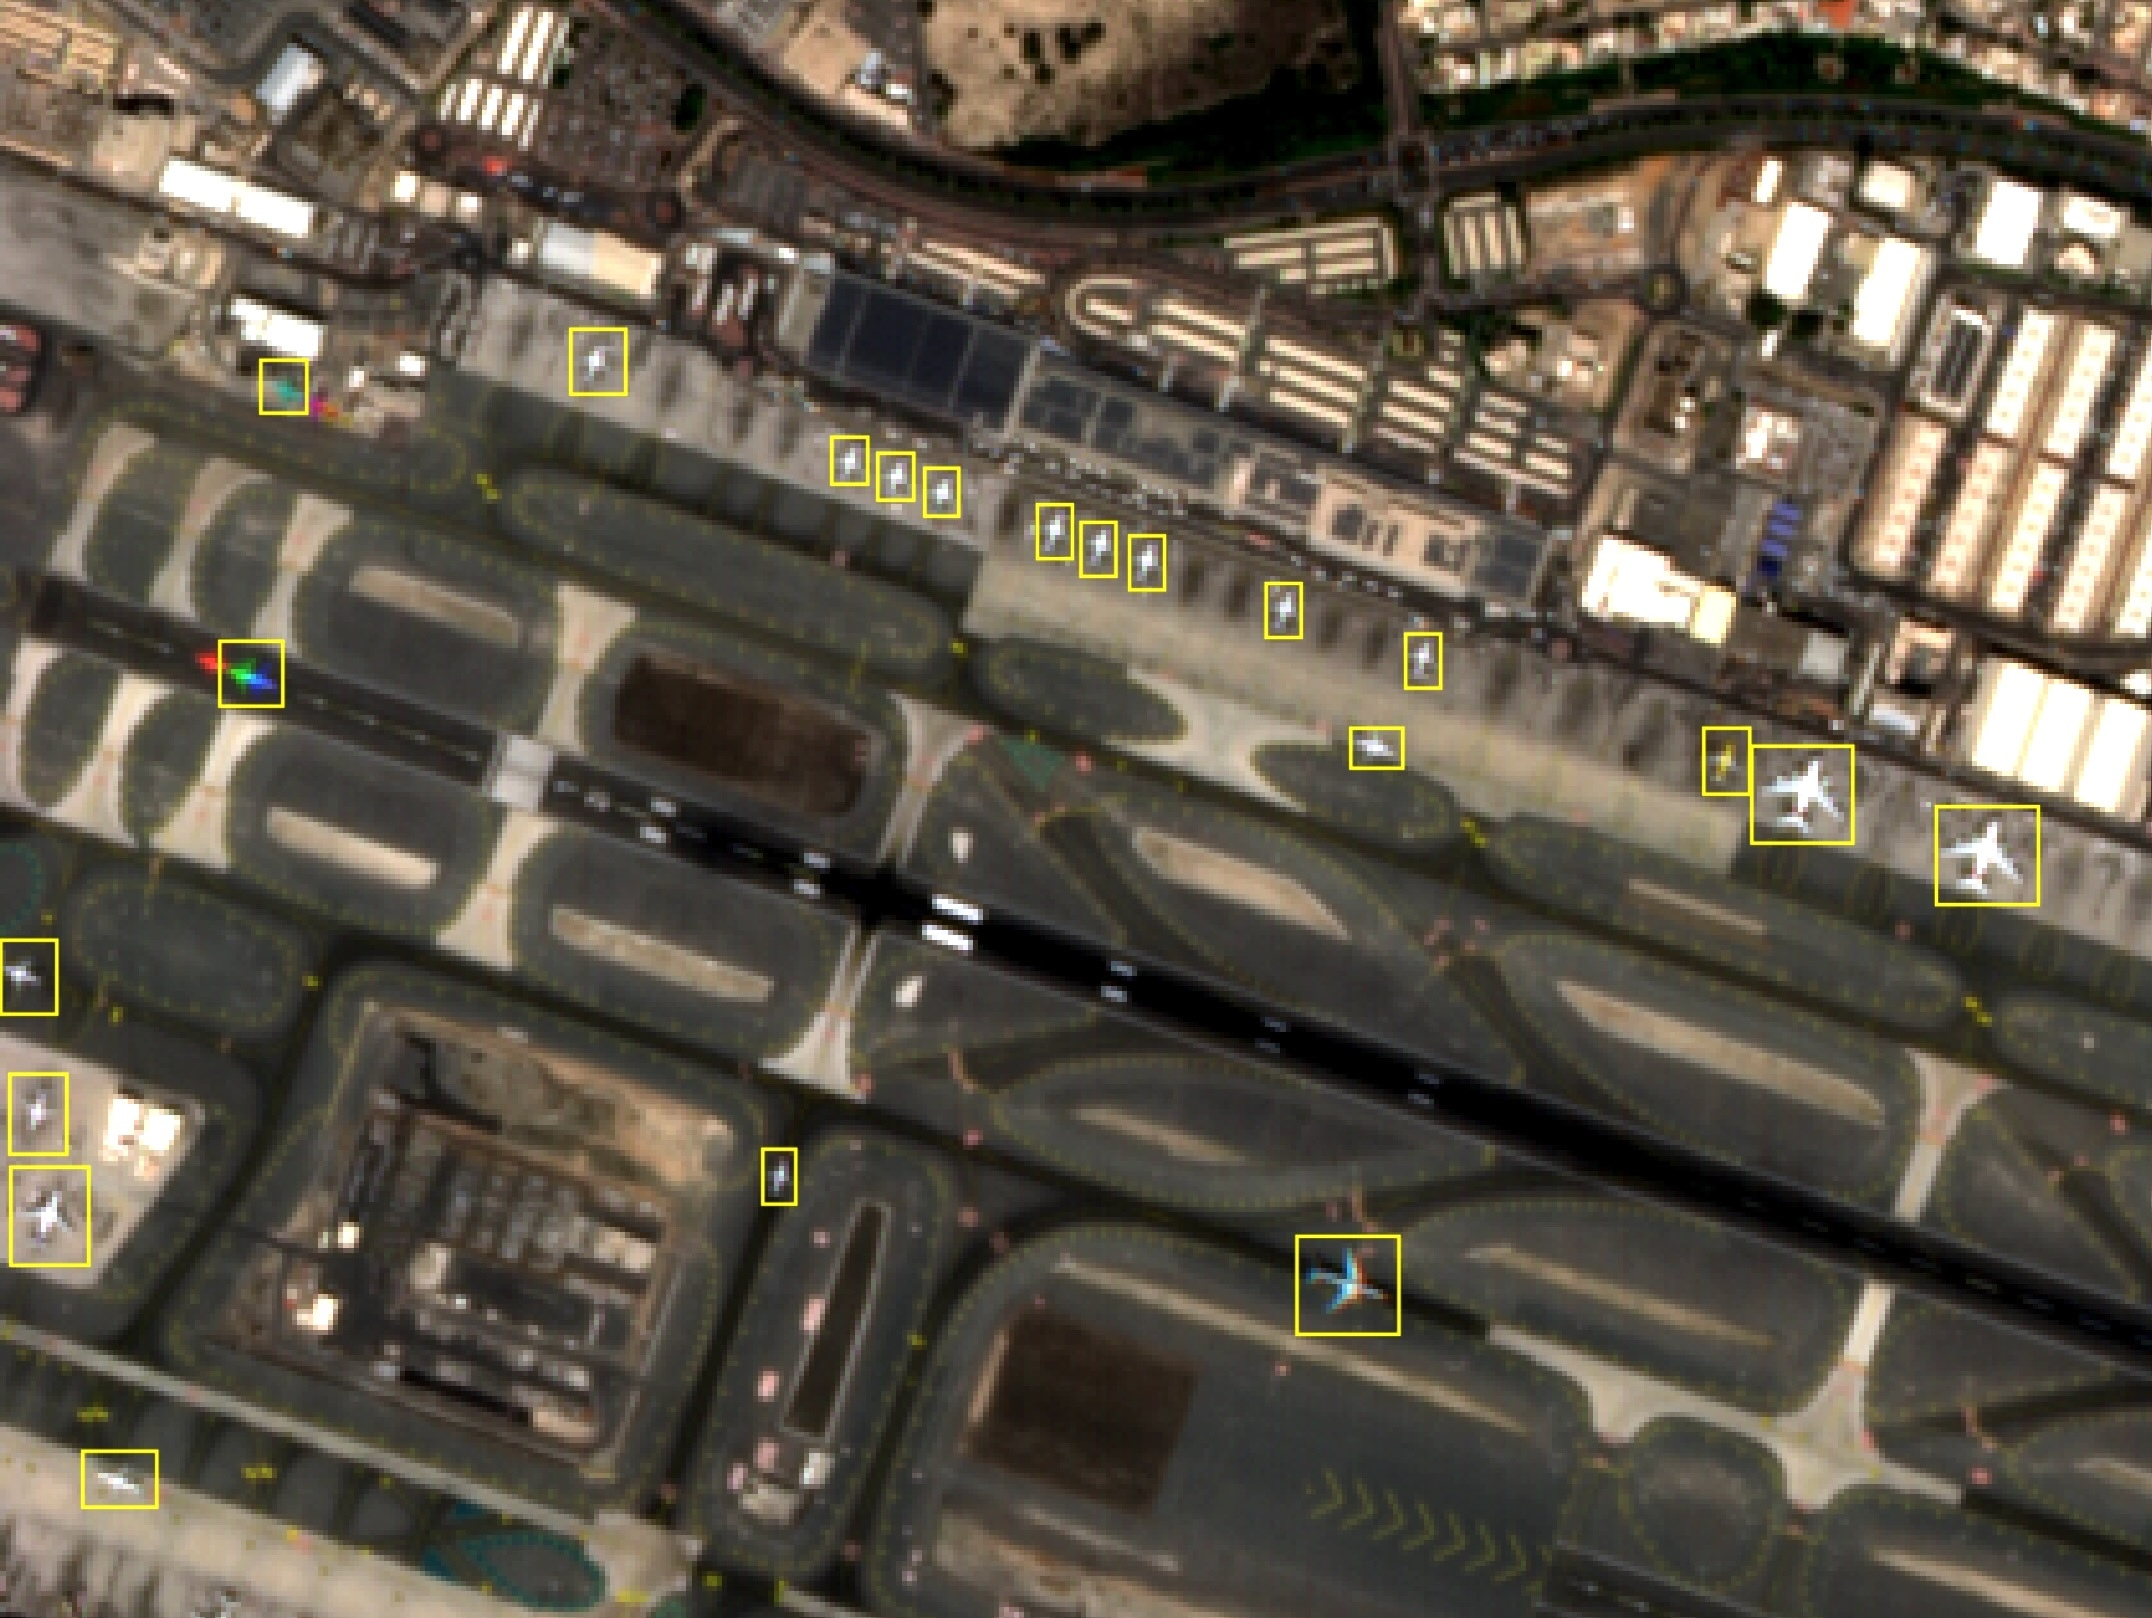
 Airports are powerful indicators of regional activity, operational readiness, and strategic intent. EarthDaily provides daily geocoded aircraft detection covering every airport globally, helping analysts monitor aircraft movement, infrastructure development, and patterns of life across civilian and military airfields worldwide. This continuous visibility supports detection of force repositioning, strategic posturing, and activity around critical transit corridors.
The Underlying Requirement
Change detection only works when observations can be compared directly over time. That depends on how the data is measured. If each image has to be reinterpreted before analysis begins, the signal is already compromised.
That matters more now because Earth observation data is increasingly being used in repeat workflows rather than one-off analysis. It moves across time, across regions, and often across systems. In that setting, small inconsistencies stop being minor. They build up and start to affect the result.
This is also where the gap in the market becomes clear. Public missions were designed for long-term consistency, but this is where much of the commercial market still falls short. It produces a large volume of imagery, but not always a record that is consistent enough to support reliable comparison over time. That is one reason AI workflows often struggle with EO: more data does not help much if the baseline keeps shifting.
In the end, change detection is only as good as the consistency behind it. In the next blog, we will look at why science-grade Earth observation data matters for government, where trusted, repeatable measurement is increasingly important for monitoring, planning, policy, and operational decision-making.
About the Author