.jpg?width=289&height=168&name=Data%20Use%20cases%20(1).jpg)
(This is the fourth blog in our science-grade data series. The first three articles looked at what science-grade Earth observation data means, how EarthDaily’s constellation is designed delivers it, and why consistency matters for change detection. Here, we look at why trusted, repeatable measurement matters for government workflows, from monitoring and reporting to planning, auditing, and operational decision-making.)
In 1972, the United States launched Landsat 1, the first civilian Earth observation satellite program. It marked the beginning of something governments did not have before: a way to observe the Earth’s surface repeatedly, using measurements designed to be compared over time.
That model shaped everything that followed. National Earth observation programs expanded across the U.S. and globally. Over time, a commercial sector developed alongside these public systems. Governments now operate their own satellites, collaborate across programs, and procure data from private providers.
The landscape has expanded, but the requirement has not. Earth observation data still has to remain consistent enough to support comparison over time, integration across systems, and use in decisions that extend well beyond a single observation.
The Underlying Requirement
Earth observation data feeds into systems that depend on continuity. Agricultural estimates are updated season after season. Forest inventories carry forward into long-term reporting. Infrastructure baselines are reused in planning and allocation decisions.
These uses are embedded in processes that carry forward previous measurements. National statistics are revised over time. Environmental reporting is compared across years. Data moves between agencies and is reused in different contexts. Once published, it is often audited, challenged, or incorporated into policy decisions.
In that setting, the data has to do more than describe conditions at a moment in time. It has to remain comparable. That comparison only works if the measurement holds.
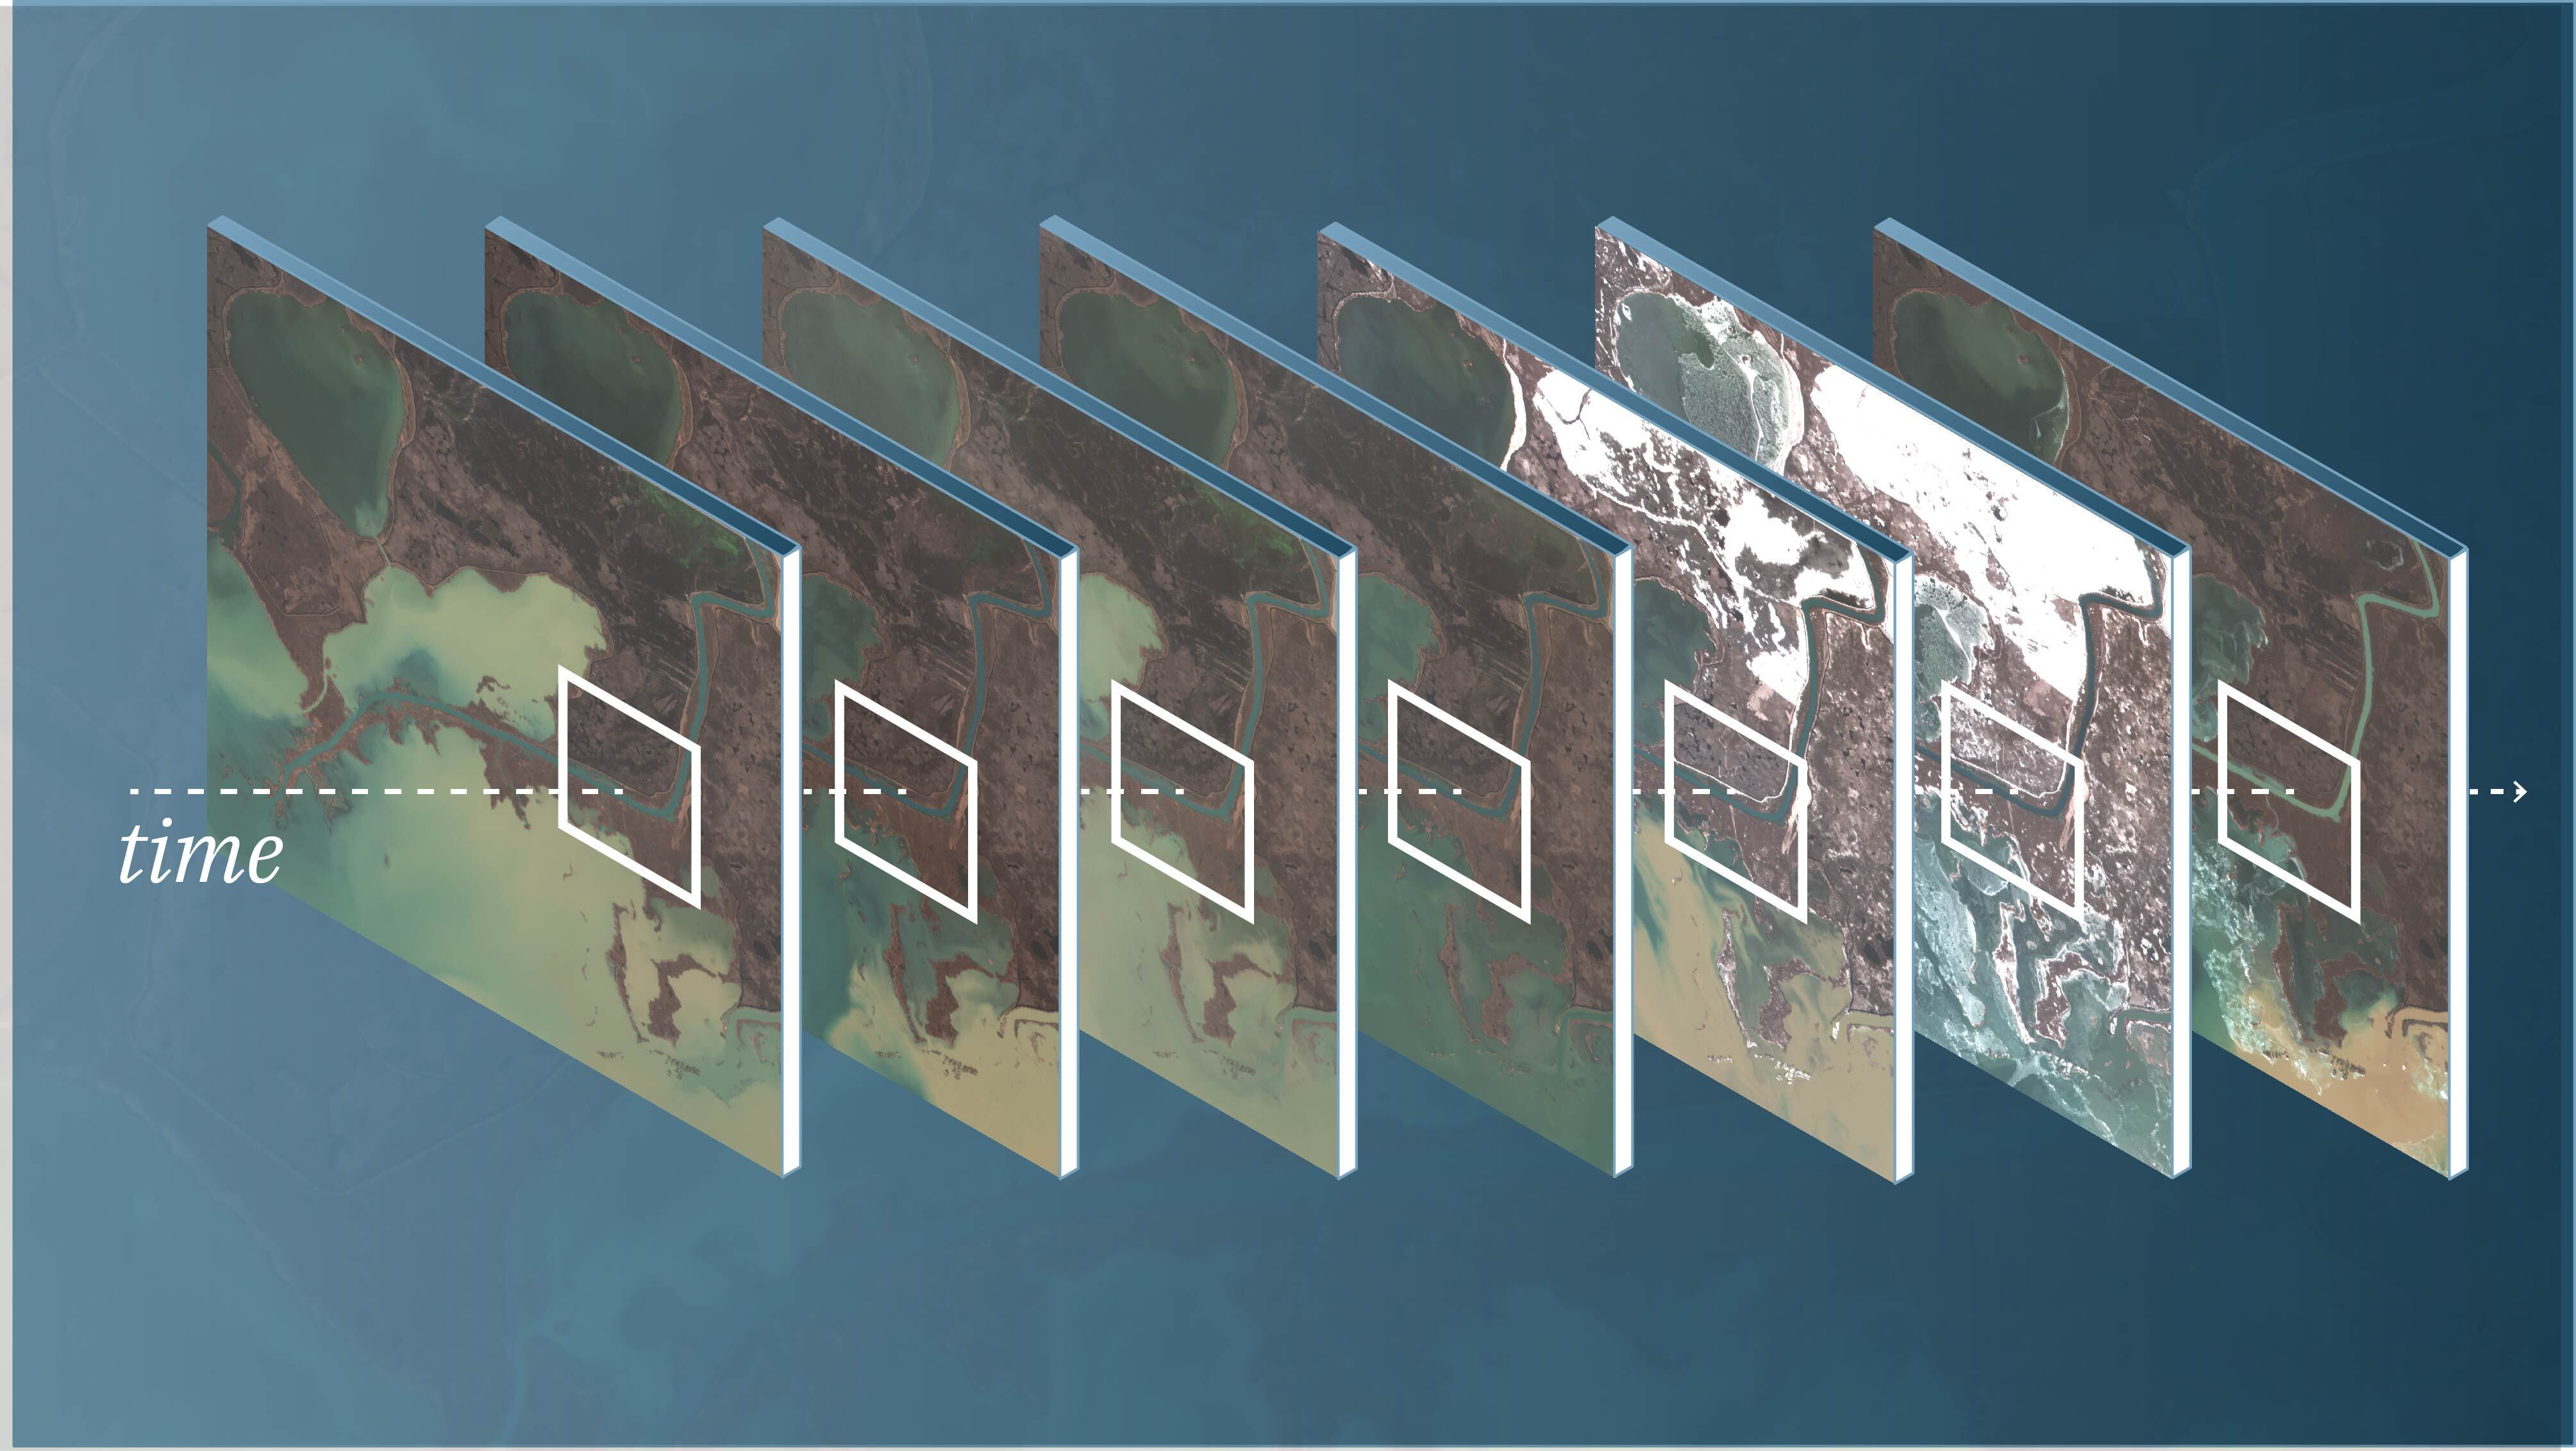
Change detection, in turn, depends on observations that can be compared directly. Differences should come from what is happening on the ground, not from how the data was captured.
In practice, viewing angle, atmosphere, and sensor behavior introduce variation. It is not always obvious in a single image. It shows up over time, as the same location is observed again and again. The data stops lining up cleanly, and each observation has to be adjusted before it can be compared.
Where This Shows Up In Practice
Government use of Earth observation spans multiple areas, often as part of ongoing monitoring and reporting workflows:
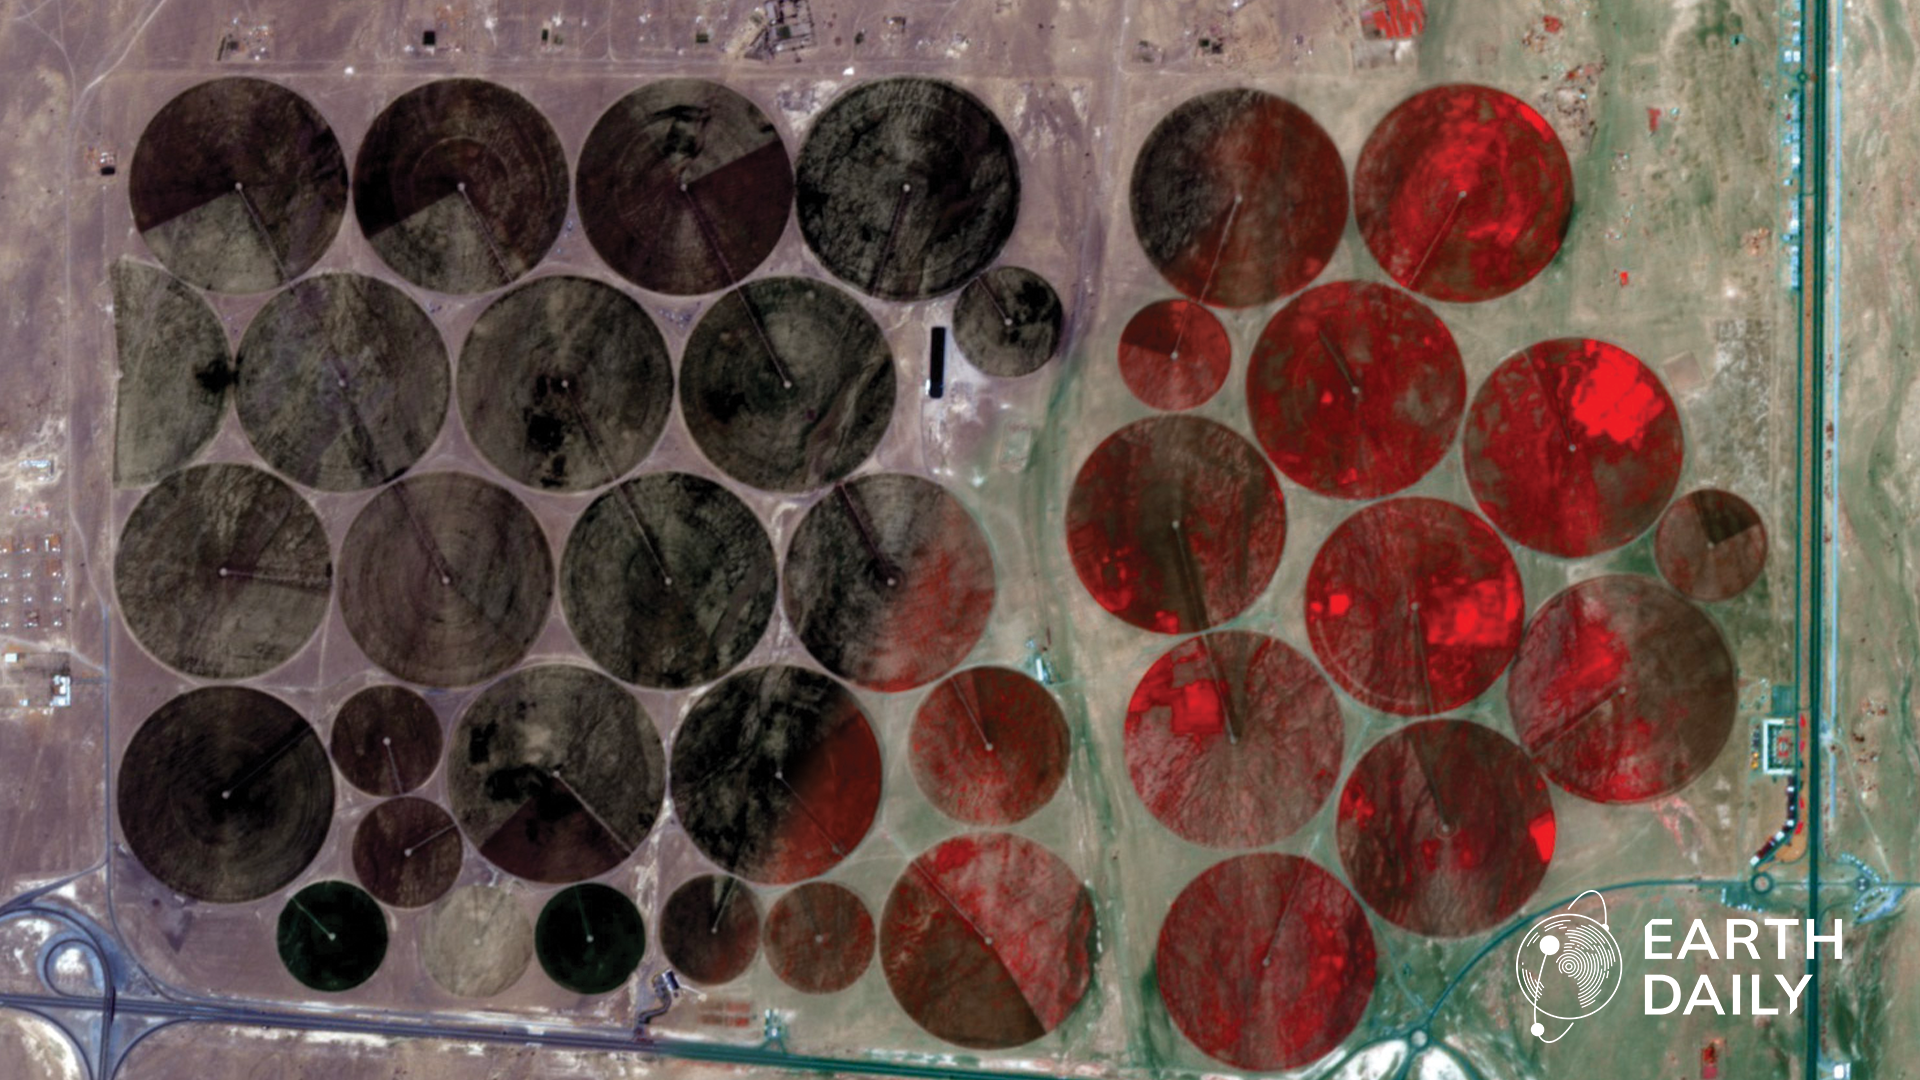
- Agriculture and Food Security: Crop conditions, moisture, and yield are tracked across growing cycles and regions.
- Environmental Monitoring and Deforestation: Forest loss, land degradation, and ecosystem change are followed over long periods.
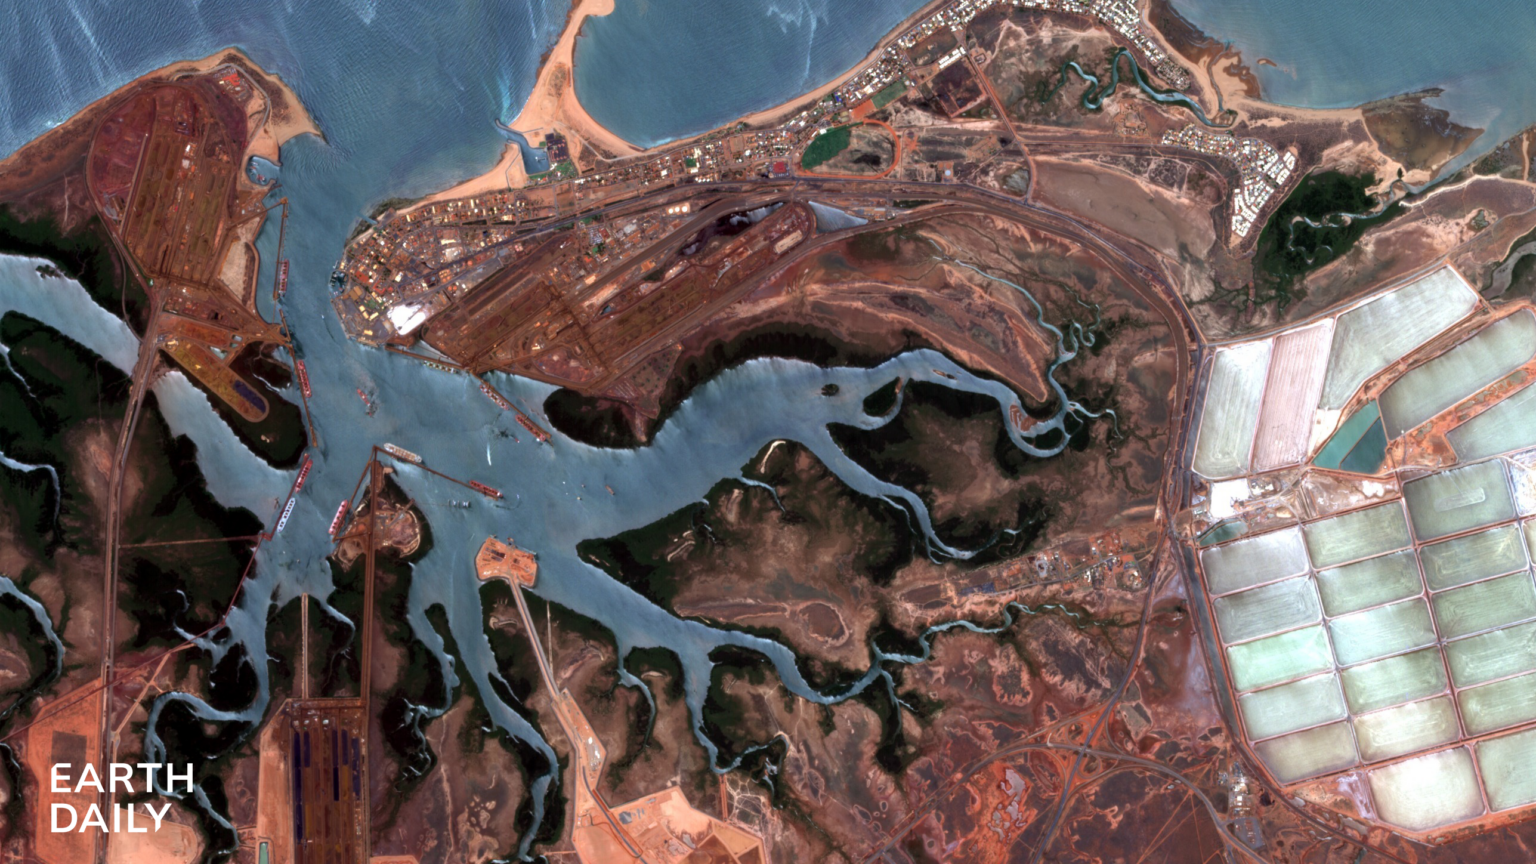
- Infrastructure and Urban Development: Expansion, construction, and land-use change are measured against existing baselines.
- Energy Systems and Utilities: Transmission corridors, pipelines, and distributed assets require continuous monitoring.
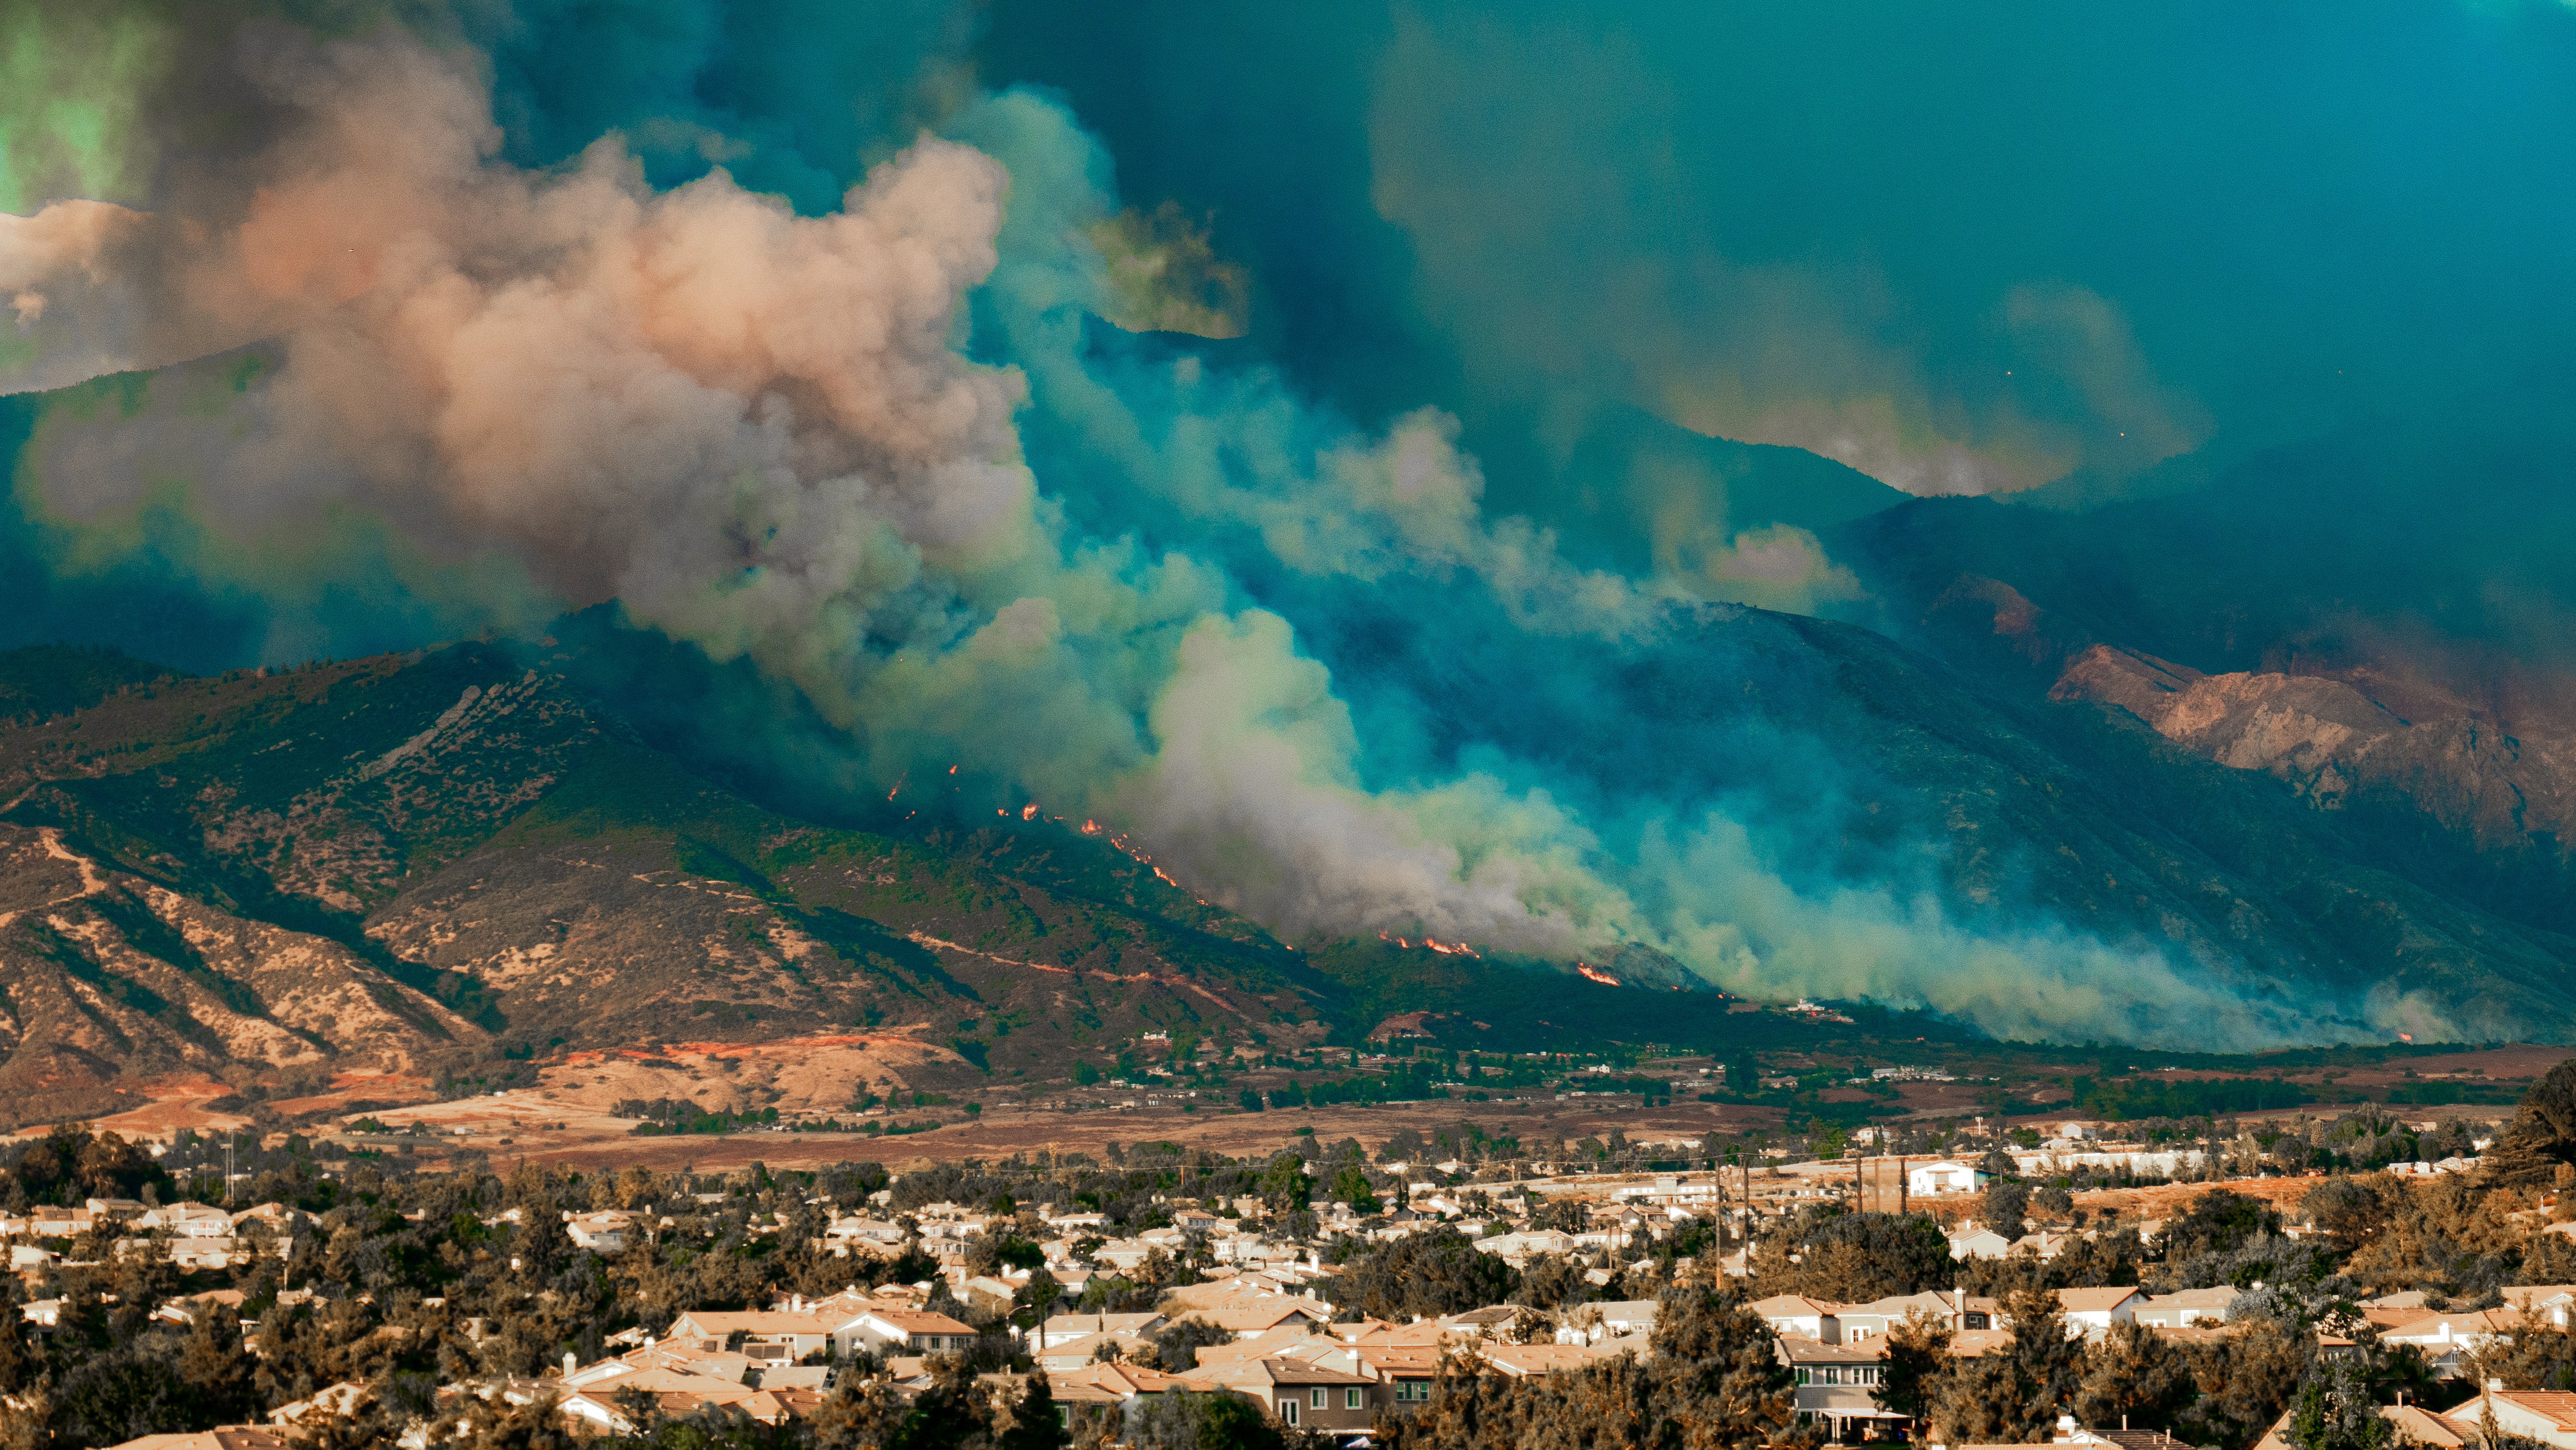
- Insurance and Disaster Response: Damage assessment depends on comparing conditions before and after events.
- Mining and Resource Monitoring: Site activity and environmental impact develop incrementally over time.
- Government Statistics and Auditing: Geospatial data feeds into national reporting and must remain defensible across revisions.
- Surveillance and Reconnaissance: Activity patterns in remote or sensitive regions are observed over repeated acquisitions.
- Maritime Security: Vessel activity and behavior are monitored across large and dynamic ocean regions.
- Sanctions Monitoring and Compliance: Changes at restricted sites are tracked across time for verification.
- Border and EEZ Enforcement: Movement patterns emerge through repeated observation across defined areas.
What Breaks Without Consistency
The impact of inconsistency is rarely obvious at first. It shows up over time, as data is reused and compared.
- Baselines begin to shift: Measurements that were once comparable no longer align cleanly. A dataset from five years ago cannot be placed directly alongside current observations without adjustment.
- Trends lose clarity: Small variations accumulate. Changes in the data begin to reflect differences in observation conditions rather than changes on the ground.
- Datasets stop aligning: When data from different systems is combined, it rarely lines up cleanly. Work starts with fixing it, not analyzing it.
- Workflows slow down: Additional steps are introduced to normalize, correct, and align the data. Preparation begins to take as much effort as the analysis itself.
- Confidence weakens: When the baseline is not stable, results become harder to defend in reporting, audits, and policy decisions.

This shows up most clearly in how government workflows operate. When the data does not remain consistent, the effort shifts away from analysis. Time is spent correcting, aligning, and interpreting datasets before they can be used. In public-sector workflows, that effort translates directly into cost.
Many departments do not have the capacity to carry out that work consistently. Dedicated analysts are limited. Technical workflows are not always in place. When the data requires additional interpretation, it is either used with uncertainty or not used at all.
That affects how assessments are carried out. It slows down reporting cycles. It introduces gaps in projects that depend on continuous monitoring.
The Role Of Science-Grade Data
Long-running Earth observation programs were built around this requirement. Measurements had to remain consistent enough to be compared across years and across systems without reprocessing each time.
NASA defines its Standard Data Products as internally consistent, well-calibrated records of Earth’s geophysical properties suitable for scientific research and applications. The emphasis is on consistency across time and across datasets.
That structure is deliberate. Calibration maintains stability in the measurement while validation ties it back to real-world conditions. Observation conditions are controlled so that differences in the data reflect changes on the ground rather than variation in how the data was captured.
When calibration and validation hold, the data lines up over time and can be compared directly. If not, every observation needs adjustment before it can be used.
 EarthDaily’s constellation is designed within this same measurement framework. Its calibration approach is aligned with established science missions, with continuous cross-calibration against multiple reference systems, including Landsat and GOES. Measurement stability is maintained through global calibration sites and ongoing monitoring of sensor behavior over time.
This keeps the data comparable across observations and interoperable with existing datasets, while extending that model to daily, global coverage.
About the Author